2018 Colorado Voter Turnout
Summary
Republicans led in voter turnout.
The Republican voter turnout advantage was much smaller than usual.
Republican ballots accounted for 31.5% of those cast, down 5.9 points from 2014.
The soft mix of ballots cast was not a result of Trump voters failing to turn out.
Voters 62+ accounted for 27% of ballots cast.
Republican turnout advantage was strongest amongst voters 56-61.
Republicans are significantly under-represented in the under 35 age range.
Republicans did a poor job of targeting the correct voters to turn out.
A full 37% of Republican ballots were returned on Election Day and the day before.
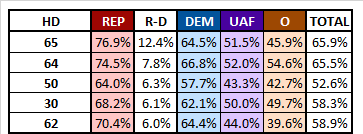
The Republican turnout advantage was highest in CD5, SD1, HD65, Lincoln and Weld.
Note: some portions of this report have been redacted for online publication as they have strategic implications for the Republican party. However, if you’re a member of the party I’d be happy to email you the full report. Just send me an email to make that request.
The Numbers
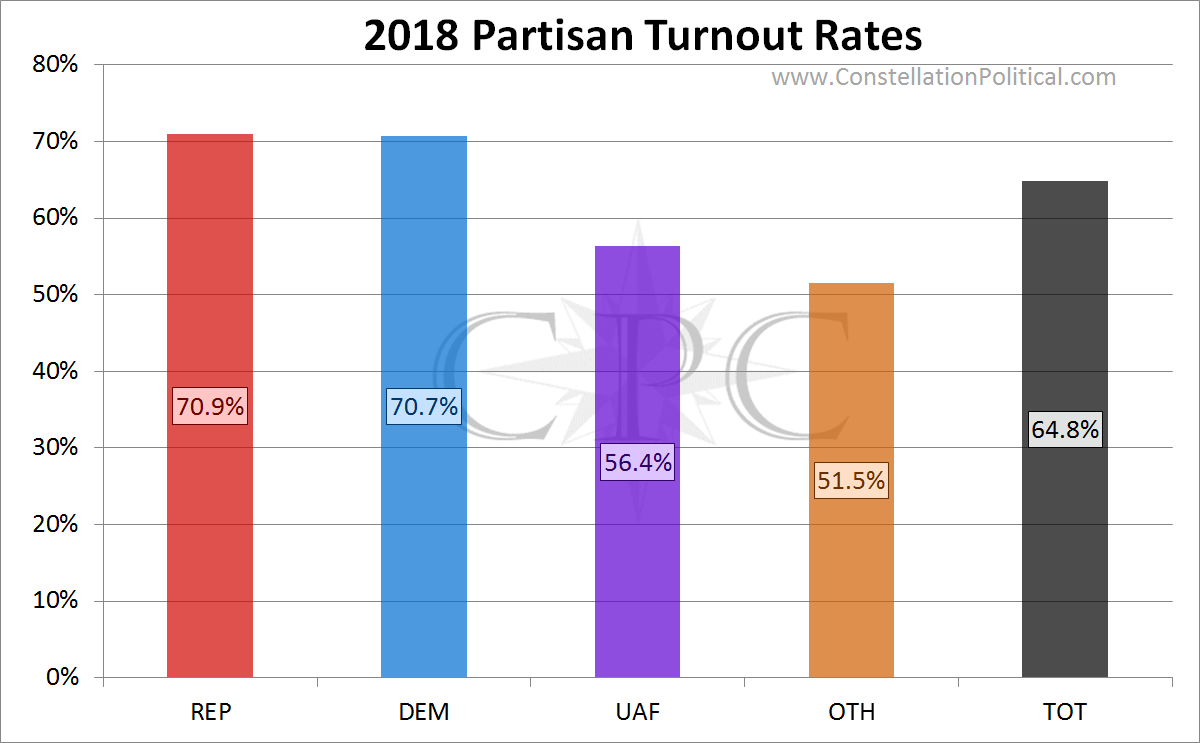
Voter Turnout by Party
Republicans turned out at the highest rate of any party, which is typical. Republican turnout was 70.9% versus 70.7% for Democrats for a +0.2 turnout premium over Democrats. However, over the past several elections the Republican turnout premium has been about +6 points. As such, this was a much worse turnout year for Republicans than in recent history.
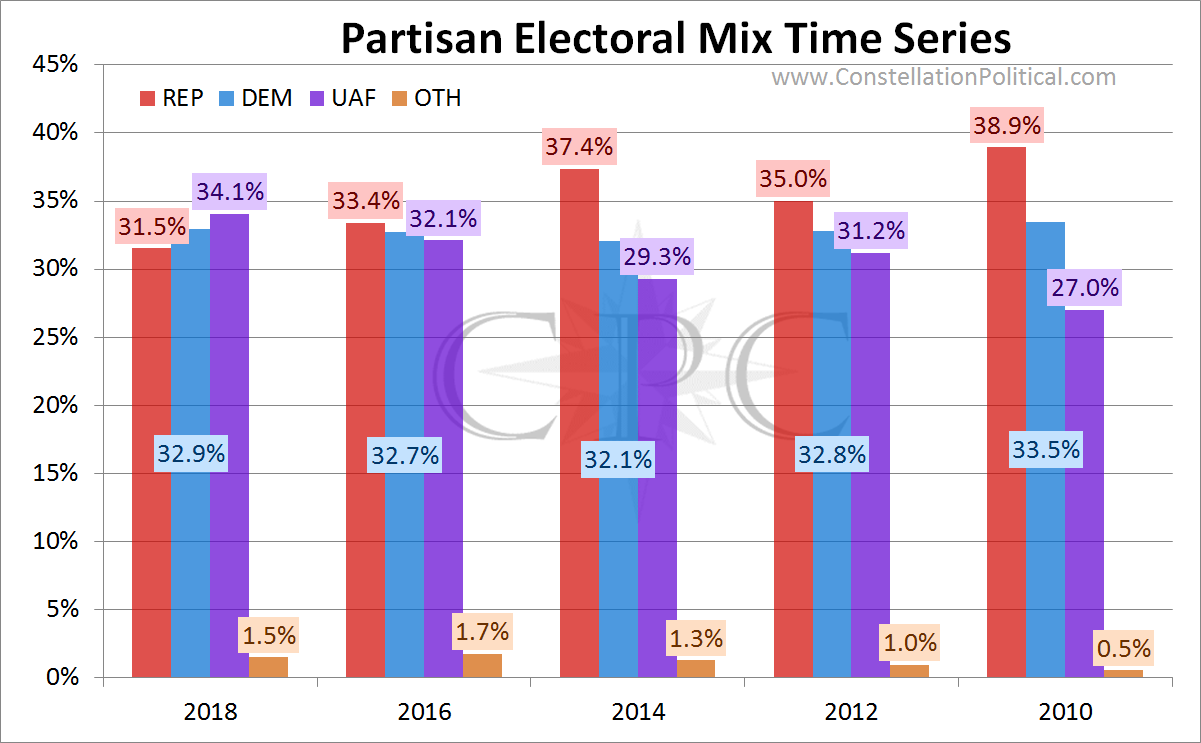
Republican’s weaker turnout advantage coupled with the new Democrat registration advantage meant that this was the worst electoral mix ever. Republicans accounted for only 31.5% of the votes cast in 2018. This is down from a high of 38.9% as recently as 2010.
Democrat’s electoral representation has remained steady between 2010 and 2018. However, Unaffiliated voter’s electoral representation has exploded – rising to 34.1% this year from 27.0% in 2010. This is primarily because of the massive growth in Unaffiliated voter registration.
The Trump Effect
The diminished Republican turnout advantage this cycle has led many to speculate that Trump voters simply stayed home. I examined this possibility so thoroughly that it became a separate analysis. In short, the claim that Trump voters stayed home in 2018 is demonstrably false. You can read the whole assessment here.
Voter Turnout by Gender
Female voters turned out at a higher rate than men and, as such, they made up a greater portion of ballots cast than men did.
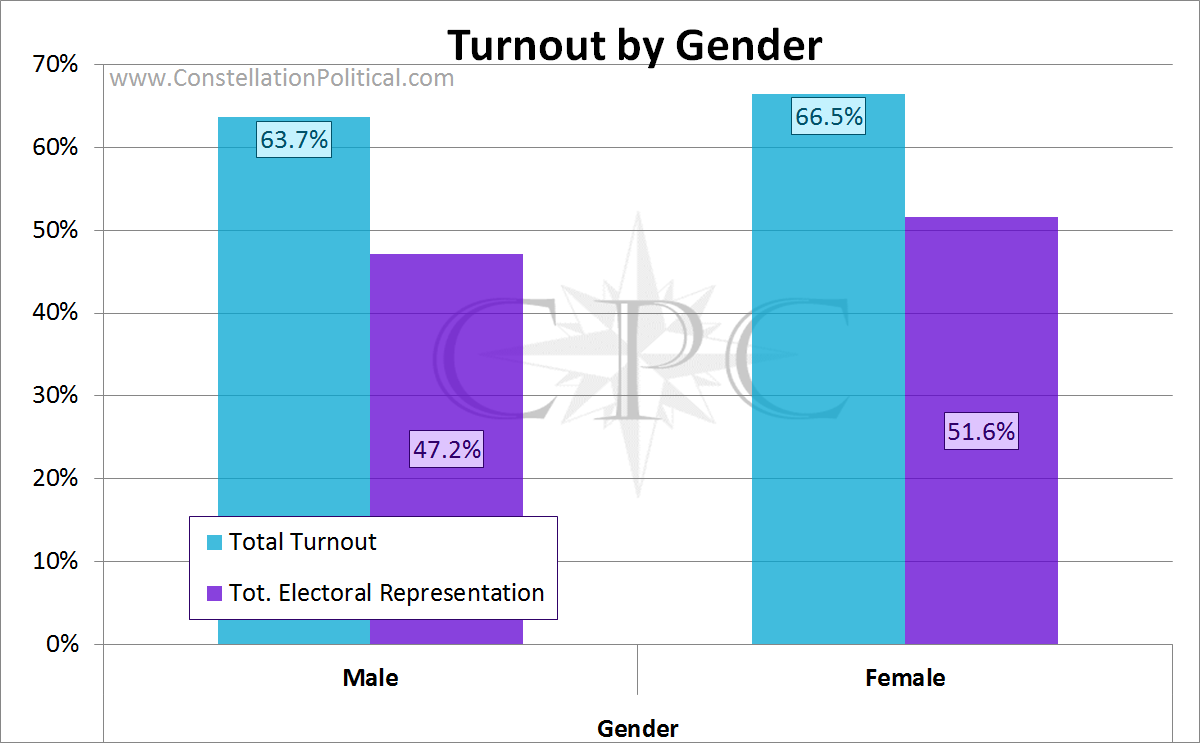
The media made a big deal out of the fact that women were turning out at a higher rate and in greater real numbers than men. However, this has been true in every recent election so that, in itself, was not that notable.
Voter Turnout by Age
Despite some misleading claims recently covered in The Colorado Sun, turnout among young voters remained depressed. Older voters continued to be overrepresented in the mix of ballots cast. As older voters tend to lean Republican, the upward skew in the mix of ballots cast by age generates a natural advantage for Republicans.
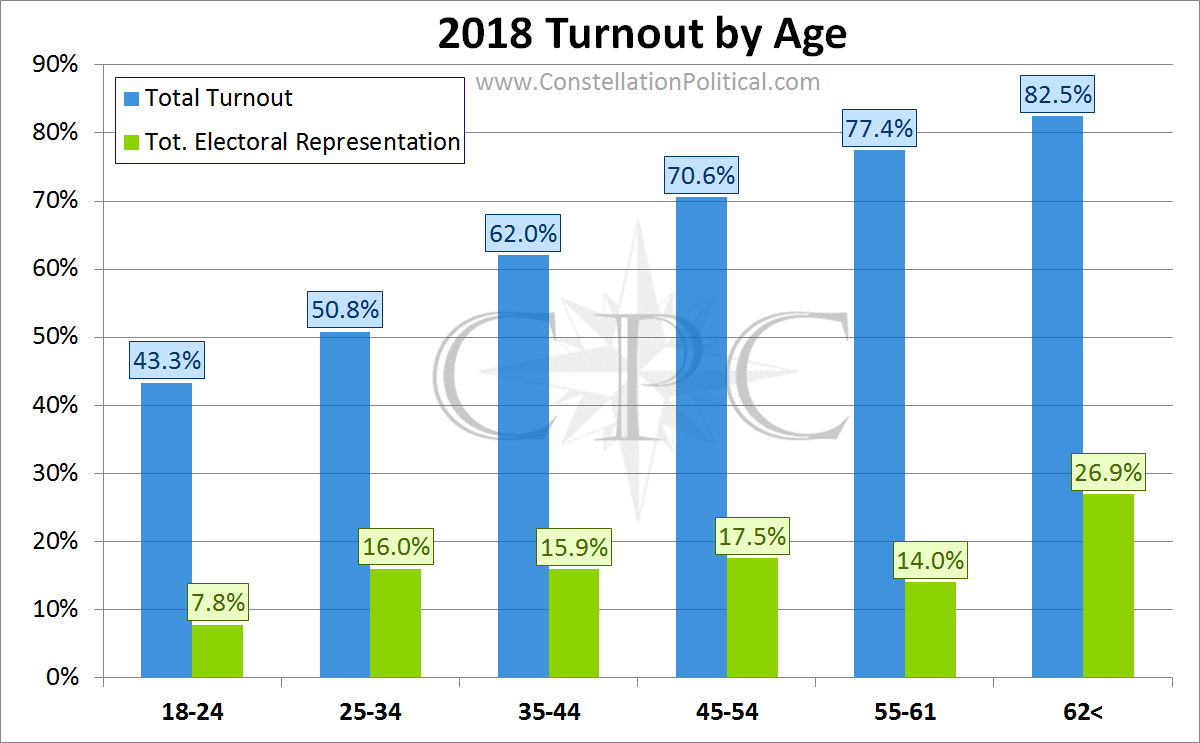
As you can see in Graph 6, voters over the age of 62 turned out at the highest rate and represented over a quarter of all ballots cast in the midterm.

Table 1 breaks out the turnout rates by party, age and gender in more detail. As you can see, Republicans had a turnout advantage in each age group of voters 46 and older. Our greatest turnout advantage was among voters 56-61. Also of note is the fact that women turned out at a higher rate in every age group save for those 62+.
Voter Turnout by Propensity
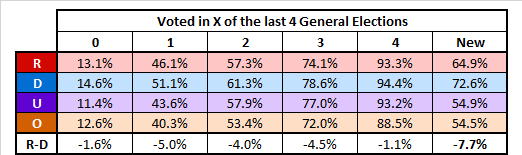
Table 2 shows the turnout rate for each party segmented by propensity to turnout. For example, among registered Republicans 13.1% of those who had never voted before cast ballots in this election, 93.3% of those who have voted in all four of the past four general elections cast ballots, and 64.9% of newly registered Republicans cast ballots in this midterm.
There was very little variation in turnout among those who vote consistently which suggests that the die-hards are still going strong. However, Democrat’s strongest turnout advantage came among newly registered voters and those who had only voted in one prior general election. This suggests that either there is heightened enthusiasm among Democrats who are becoming newly engaged in the process or that Democrats are better at targeting the correct voters to turnout.
Voter Turnout Timing
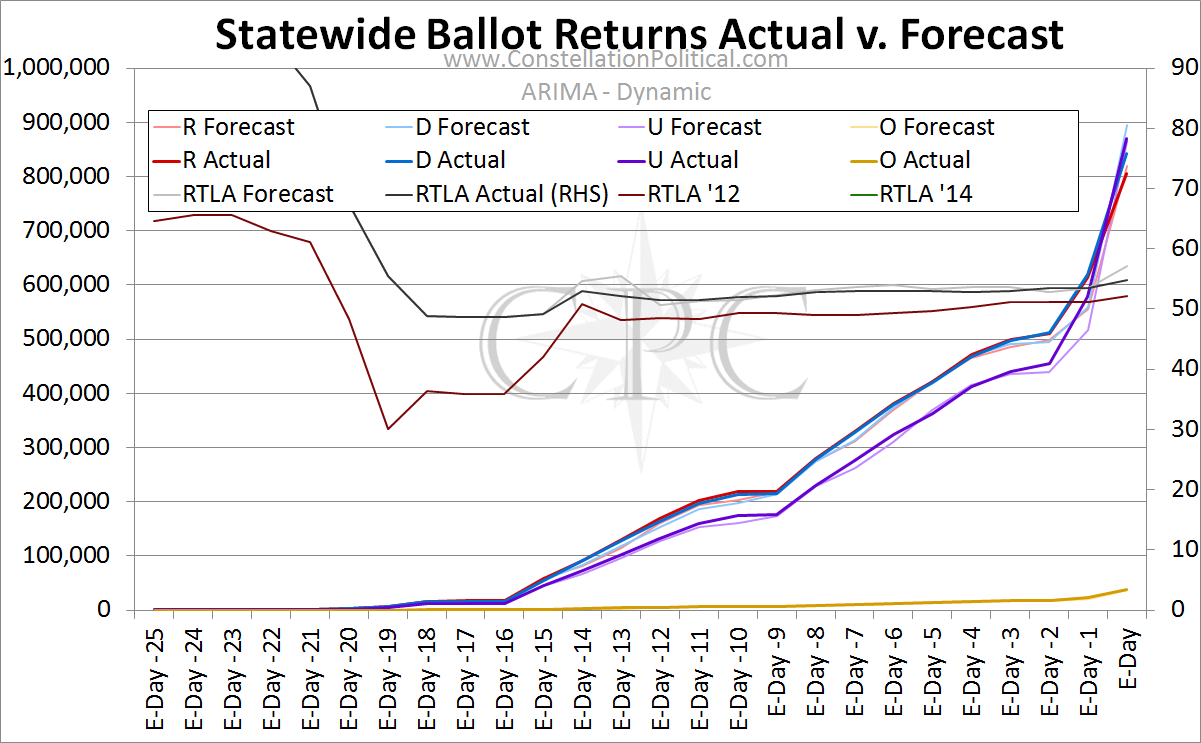
There is an extremely pervasive myth that most voters return their ballots as soon as they receive them. I have been trying to debunk this myth for years with no success. Graph 8 shows how many ballots were turned in by members of each party in the run-up to Election Day.
A full 37% of Republican ballots were returned on Election Day and the day before.
Geographic Turnout
The below map shows the Republican turnout rate for each County.
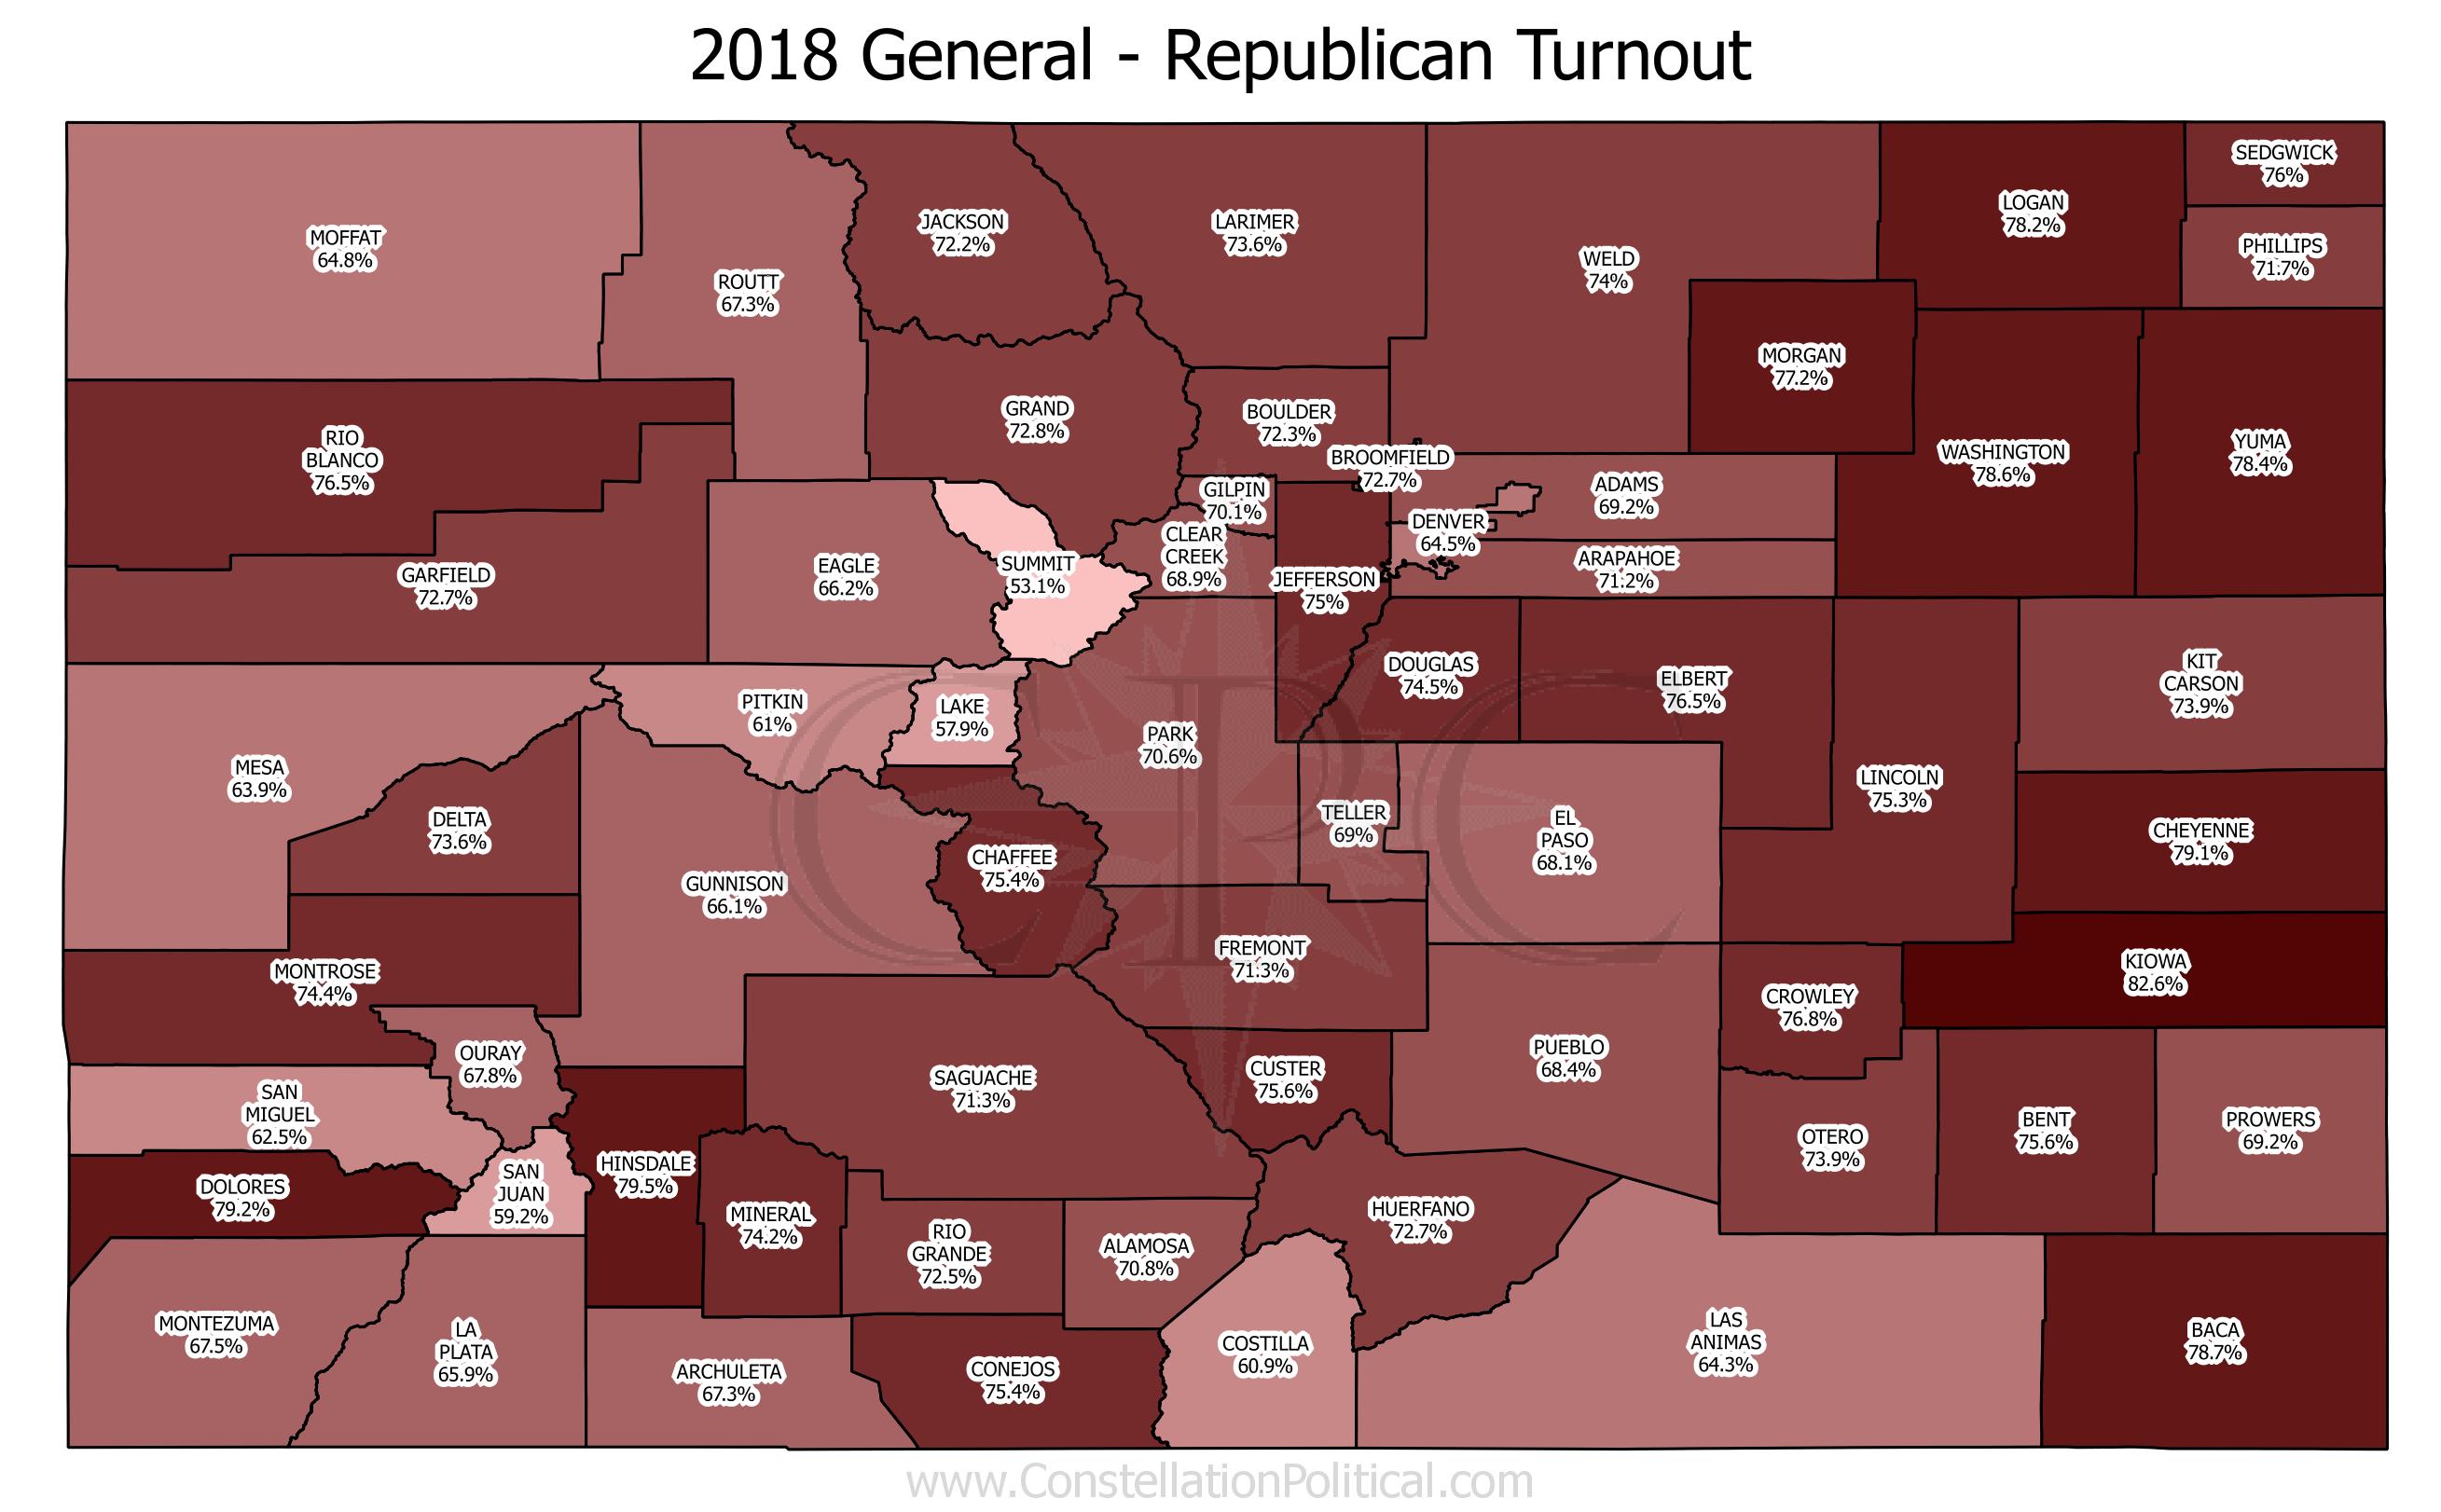
As you can see, Republican turnout was strongest in our Eastern counties this year.
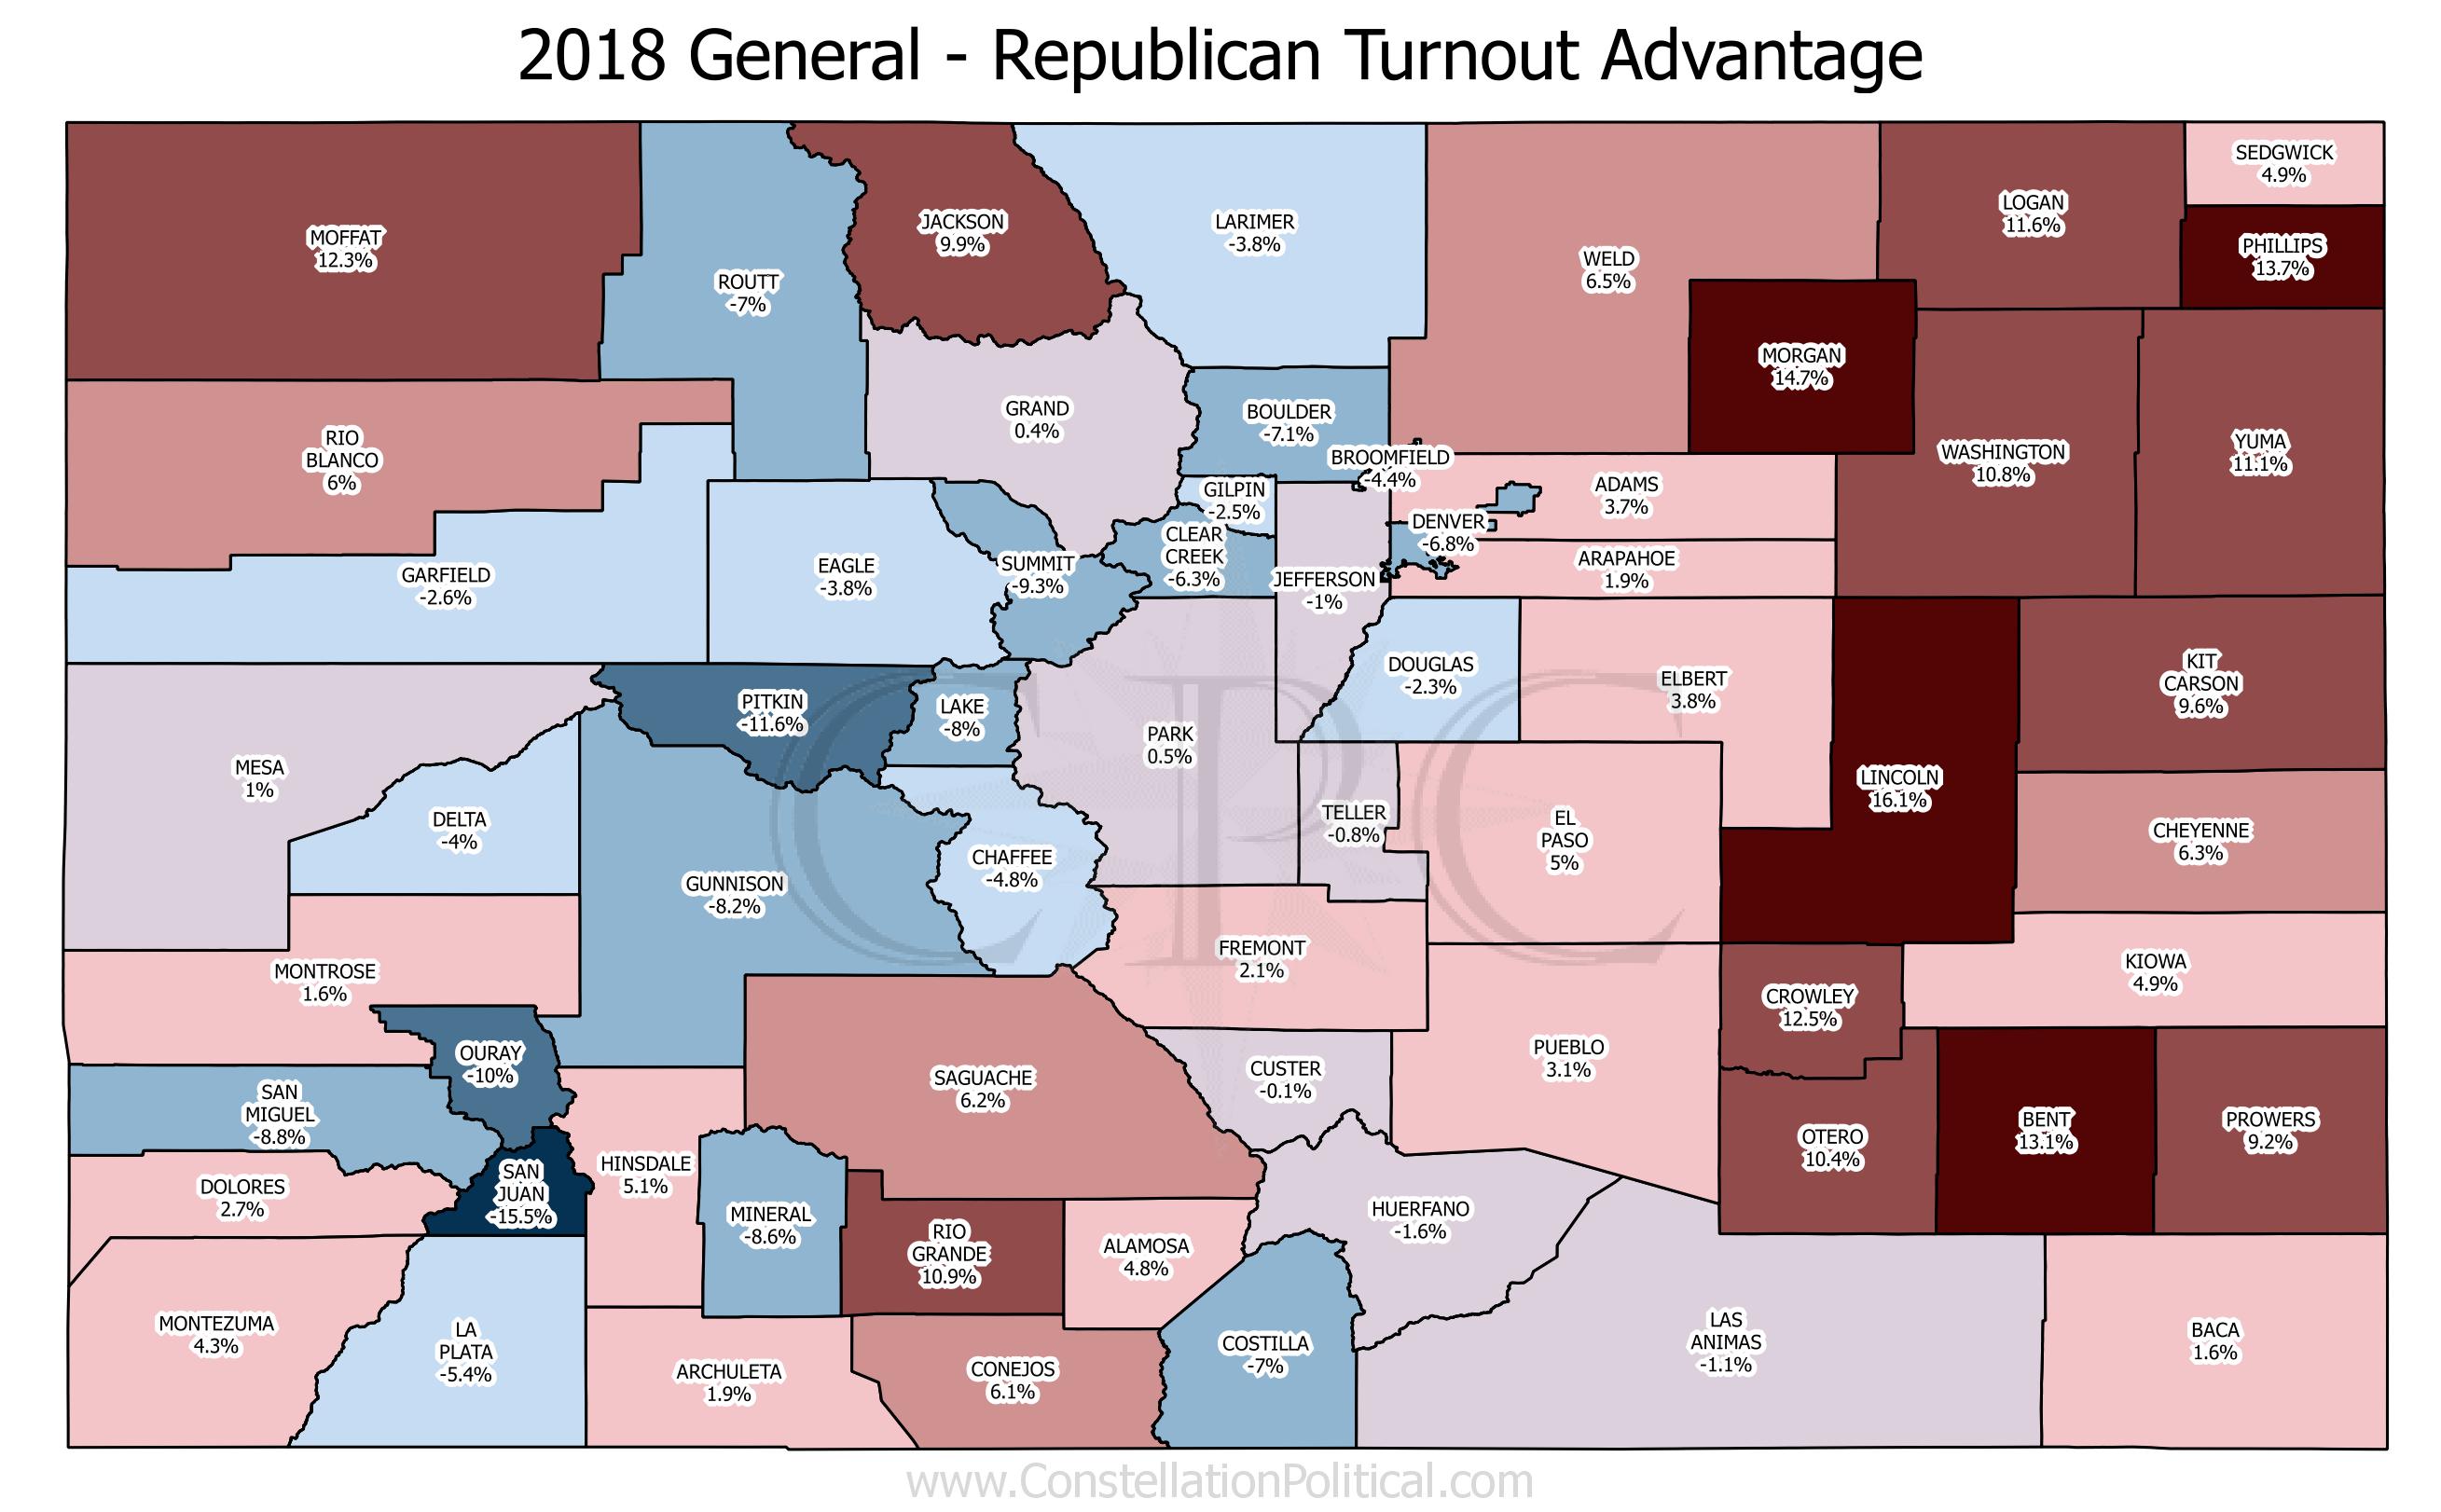
Map 2 shows the Republican turnout advantage. This is the Republican turnout rate minus the Democrat turnout rate. This is the turnout measure that we are trying to push higher when conducting get-out-the-vote.
However, having a turnout advantage doesn’t necessarily mean having more Republican ballots cast than Democrats. In some counties registration can prevent Republicans from ever having an advantage in ballots cast.

Map 3 shows the Republican advantage in ballots cast as a percentage of all ballots cast in that county. As you’d expect, the Republican ballots cast advantage is strongest on the plains where we have a commanding registration advantage.

Map 4 shows each county’s contribution to the total number of Republican ballots cast. El Paso led the pack with 15% of all Republican ballots cast in the midterm.
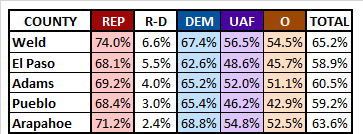
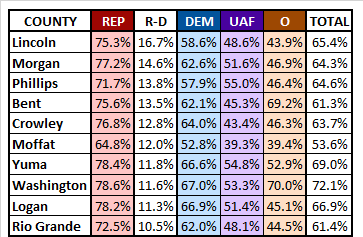
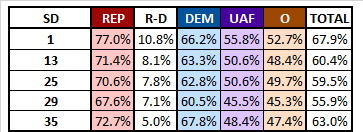
Voter Turnout Leaderboards
Lastly, let’s take a moment to acknowledge our top performers. The below tables show the top geographies for Republican voter turnout advantage (R-D): the best Tier 1 counties, the best counties overall, the best State Senate districts, and the best State House districts.