 Colorado’s Split Ticket
Summary
Coloradans have a history of returning candidates from both parties in statewide elections.
In 2018 there was a significant reduction in the statewide undervote.
In 2018 Coloradans were much less likely to vote a split ticket.
The Numbers
The country is growing more politically polarized and it looks like Colorado is along for the ride. In the 2018 midterm far fewer Coloradans voted a split ticket than they historically have. For Republicans running in Colorado this is a worrisome trend, particularly with President Trump at the top of the ticket.
Folks who have been around Colorado politics for a while tend to accept the maxim that Colorado is a moderate swing state. Coloradans have a history of returning split tickets. Just in recent history Colorado has:
Voted for George Bush and Ken Salazar in the same year.
Turned down Bob Beauprez for Governor while electing Mike Coffman and John Suthers.
Elected Hickenlooper and Bennet in the same year as Gessler, Stapleton and Suthers.
Elected Cory Gardner and re-elected John Hickenlooper in the same year.
And trounced Trump while handing Heidi Ganahl one of the best GOP performances in recent history.
But, as they say, that was then… this is now.
President Trump’s election created a tectonic shift in the political landscape. Coloradans seem to be following suit in the nation’s growing political polarization.
The Undervote
Note: For the purpose of these comparisons I summed the 2010 results for Maes & Tancredo. …because that was such a bonkers outcome that it would have introduced a great deal of “false variance” into the result.
An often overlooked cause of split ticket outcomes is the undervote. Republican voters are more likely to fill out their full ballot so Republican candidates are met with greater success further down the ballot. Indeed you can see in Graph 1 that bad years for Republicans in Colorado tend to be those where more people vote for all four of the state’s constitutional offices.
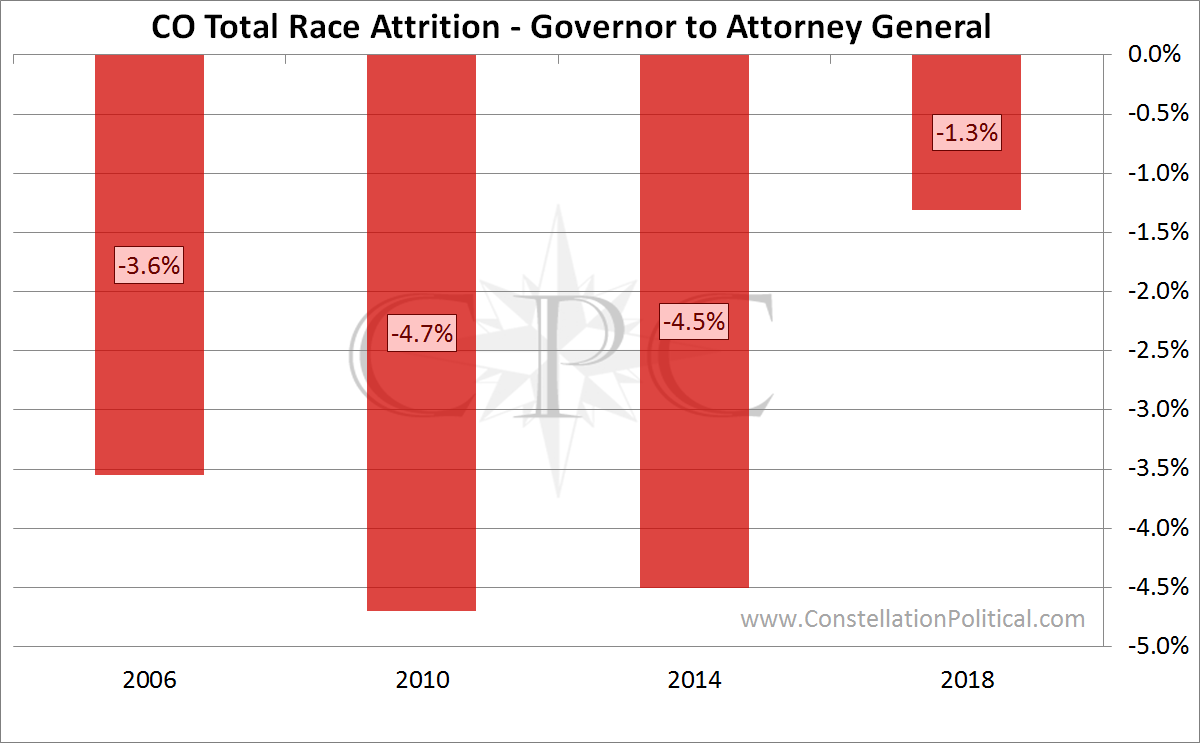
Graph 1 shows the difference in total ballots cast between the race for governor and attorney general as a percentage of the total ballots in the governor’s race.
In the past four gubernatorial years there has been a surprising undervote between the governor and the attorney general just three lines further down the ballot. However, 2018 saw a dramatic decrease in this undervote.
Of course, some of this variation can come from candidate and race dynamics. So let’s examine the undervote from the top of the ticket down to the statewide regent, this also gives us more elections to work with.
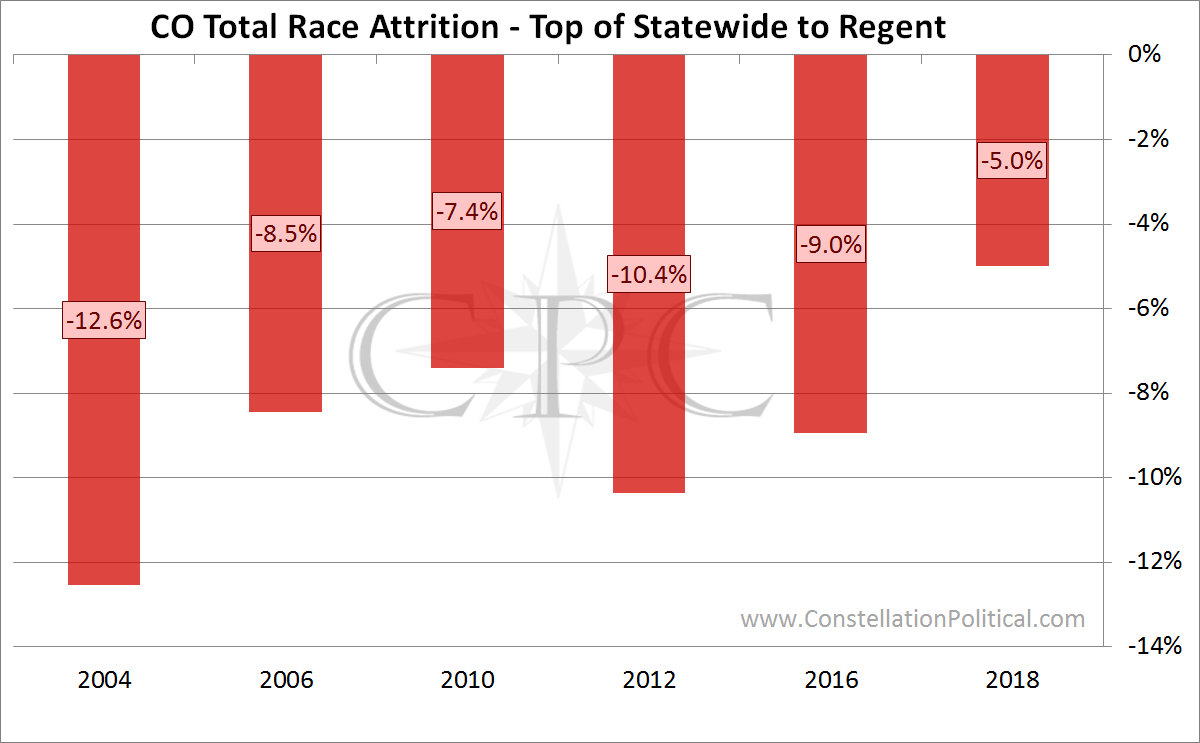
Graph 2 shows the difference in total ballots cast between the highest statewide on the ticket and the statewide regents race as a percentage of the total ballots cast in the higher race.
Once again we can see that there was a notable decrease in the undervote this cycle compared to prior years.
Split Tickets
So what is happening among the folks who do vote down the ticket?
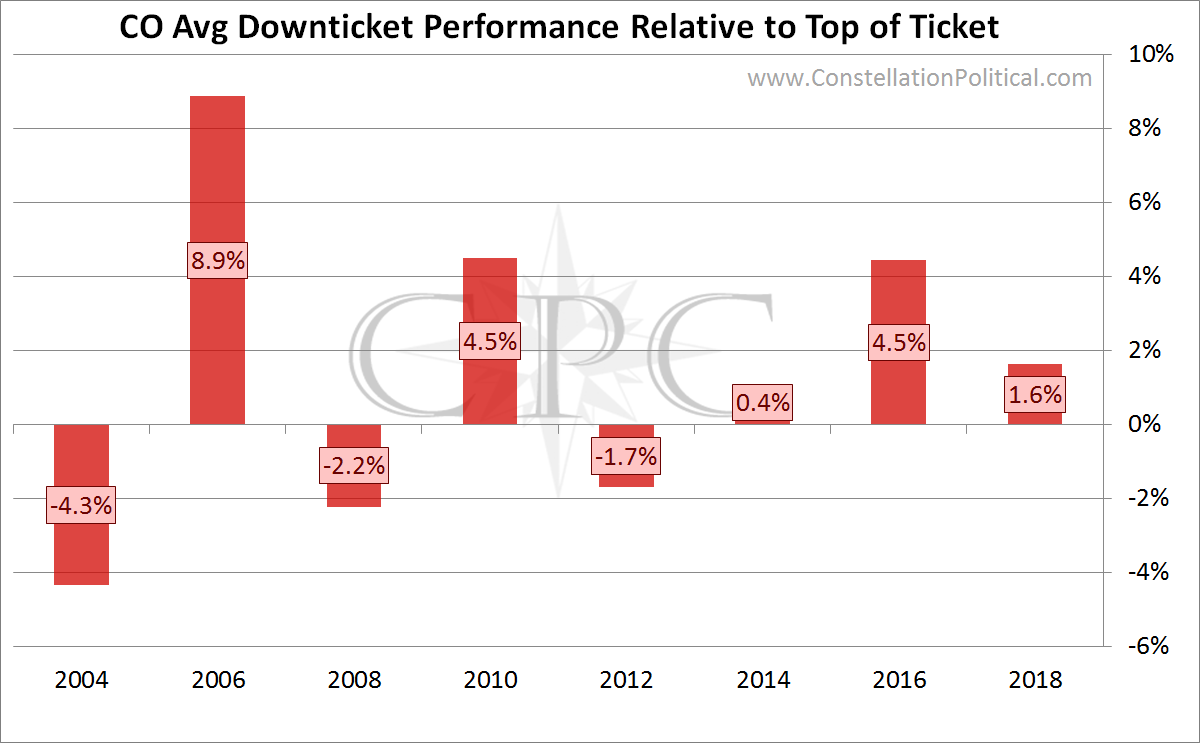
Graph 3 gets a little complicated. This graph shows the average point difference in the percentage of the vote received by the top of the ticket and the rest of the down-ticket statewide races. For example, in 2018 Stapleton received 42.8% of the vote. The other statewide candidates all did better. Williams at 44.7%, Watson at 44.9%, Brauchler at 45.1% and Montera at 43.0%. Those remaining candidates did, on average, 1.6 points better than Walker.
Graph 3 shows that people do make candidate based distinctions when voting. But we all knew that already. The problem with Graph 3 is that it says more about the candidate at the top of the ticket than it does about people’s actual split ticket behavior. In 2018, 2016, 2010 and especially 2006 we had top-ticket candidates with very weak performances so naturally our other candidates did better.
Here is a better way to consider this question.
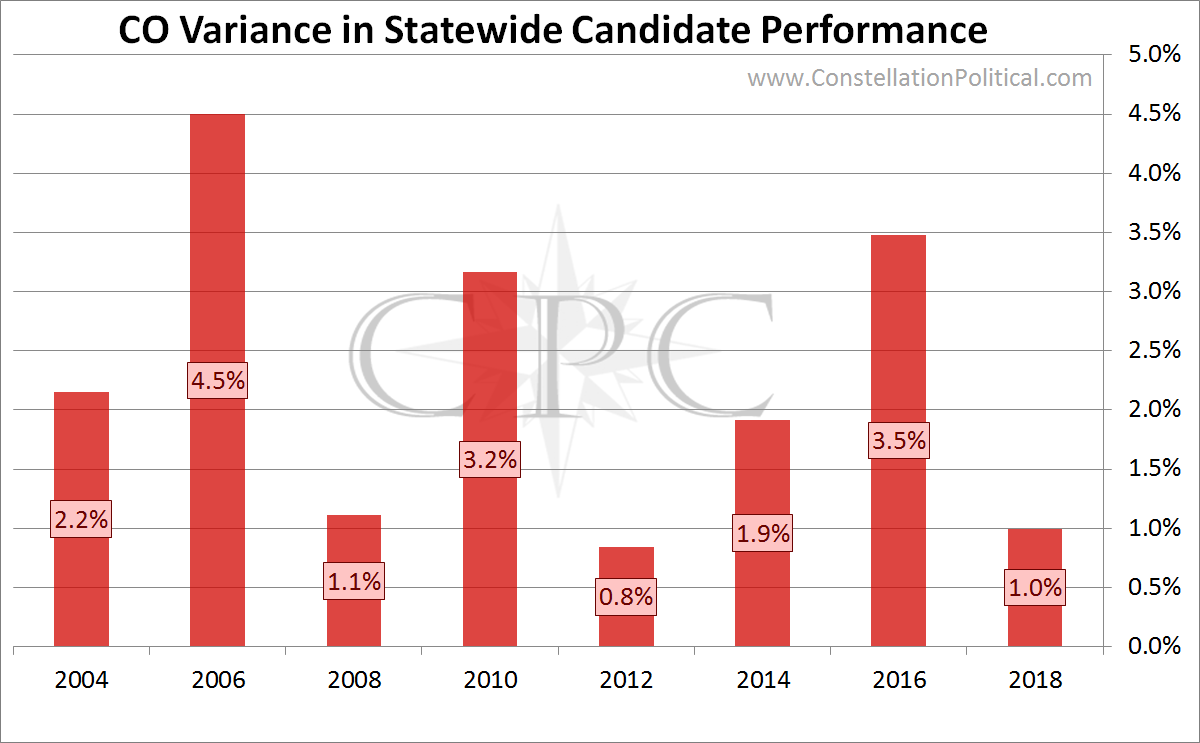
Graph 4 shows the variation in the percentage of the vote received by our statewide candidates each cycle. This isn’t a perfect comparison, however. The number of statewide candidates in a given year influences this measure. Obviously there is going to be more “swing” in a year when we have six statewide candidates versus a year where we only have two.
The only year where there was less variation in the statewide outcome than 2018 was 2012. And in 2012 there were only two statewide candidates – Romney and Davidson.
For a true sense of the change in split tickets we should compare like-for-like years. 2014 and 2006 both had the same number of statewide candidates as 2018. And 2014, 2010 and 2006 all featured the Colorado constitutional offices. We can see there were far fewer split tickets in 2018 than in any of those prior similar years.
Conclusion
The drop in split tickets this cycle demonstrates that Coloradans are becoming more polarized. There are no signs of this trend reversing for the 2020 cycle so this race will be much more about the letter after a candidate’s name than their particular policies.
There is precedent for our candidates being able to isolate themselves from the prevailing winds of Colorado politics as we saw with Heidi Ganahl in 2016. However, as a candidate for Federal office Senator Gardner will have to work harder to make those distinctions in 2020.
The analysis above captures all voters. So one potential bright spot is, despite some speculative claims to the contrary, the Republican base seems more likely to stick with our candidates as well. The only problem with that is that Republicans are still the minority party in Colorado.