 Dr. Frank’s Analysis is Wrong
A summary of problems/questions
All of the data he based his original analysis on is verifiably false.
He claims that his analysis produces the same result regardless of the data it’s based upon.
He has refused to disclose the “6th order polynomial” that produces his predicted ballots cast.
Improperly compares 2020 registration totals to 2010 Census data.
Arrived in Colorado knowing his data was bad and intending to present it regardless.
Once again, I find myself getting blown up with claims of statistical proof of voter fraud in Colorado. And once again, it’s simply a case of the underlying data being wrong.
Incorrect Data
Dr. Douglas G Frank has been giving presentations claiming he’s uncovered an algorithm that can precisely replicate turnout in each of Colorado’s counties during the 2020 election. Unfortunately, every single one of the underlying data points he presents is wrong. He may as well be analyzing March Madness scores for all the relevance his data has to the Colorado Election.
Every single one of the underlying data points Dr. Frank presents is wrong.
In an attempt to put this to bed once and for all I’ll break it down piece by piece below.
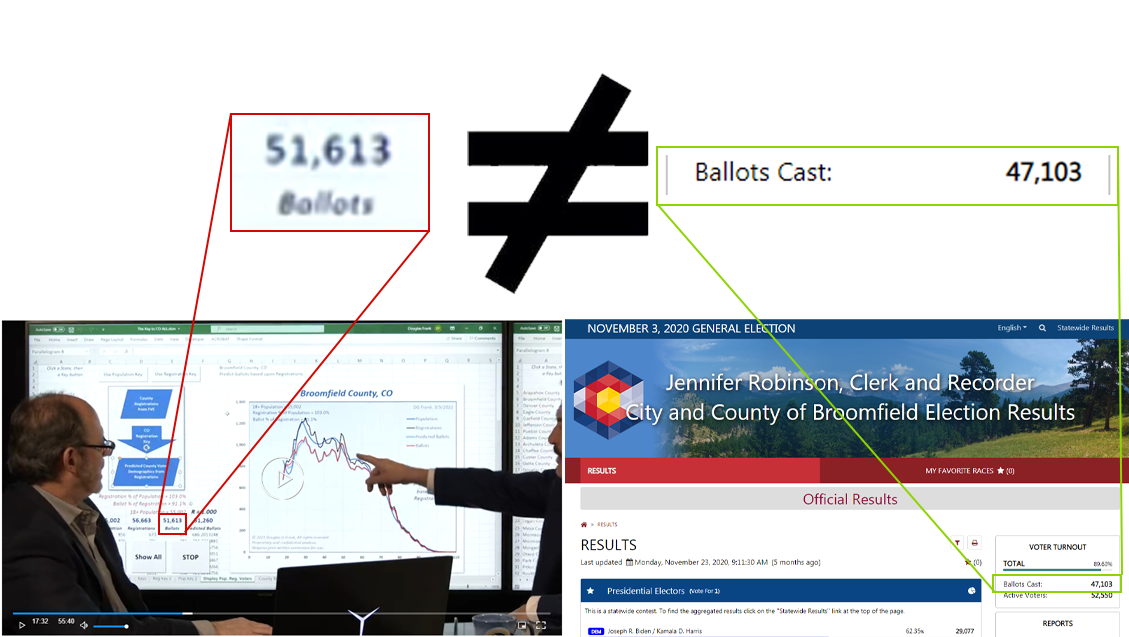
Below is a screenshot from Dr. Frank’s appearance on LindellTV. You can see from the screenshot this happens at the 17:32 minute mark.
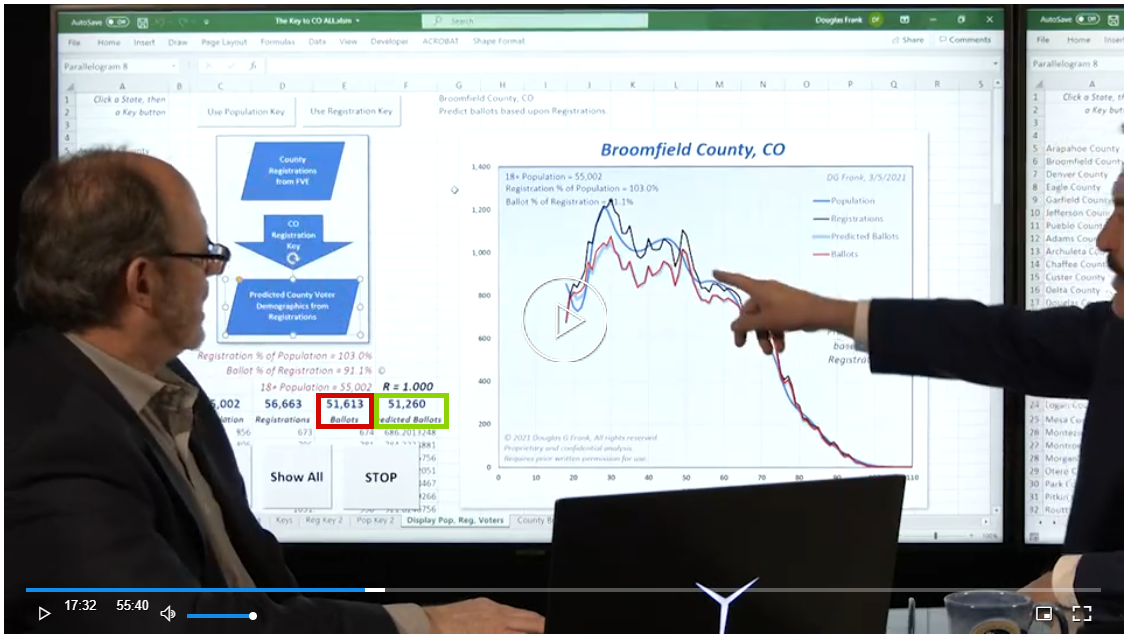
Here, Dr. Frank is claiming that his algorithm almost perfectly predicts the number of ballots cast in Broomfield County in 2020. His prediction is in the green box, he predicted that 51,260 ballots should have been cast. In the red box is the number of ballots he claims were actually cast — 51,613. Dr. Frank believes 51,613 ballots were cast in Broomfield County in 2020. There’s just one problem — he’s the only one that thinks that! Both the Secretary of State and the Broomfield Clerk report that 47,103 ballots were cast. Here’s the link to the Broomfield Clerk report.
His estimate isn’t just off by nine percent, the number he’s using for verification is too! This isn’t an isolated incident, he’s using incorrect ballots cast figures as the basis for his entire analysis. You can’t get a real result when the underlying data you use is wrong.
Dr. Frank is using incorrect ballots cast figures as the basis for his entire analysis.
At the 41:01 minute mark in the same video, they show Jackson County. Dr. Frank claims 1,004 ballots were cast there. But in reality, it was 889.

Screenshot 2 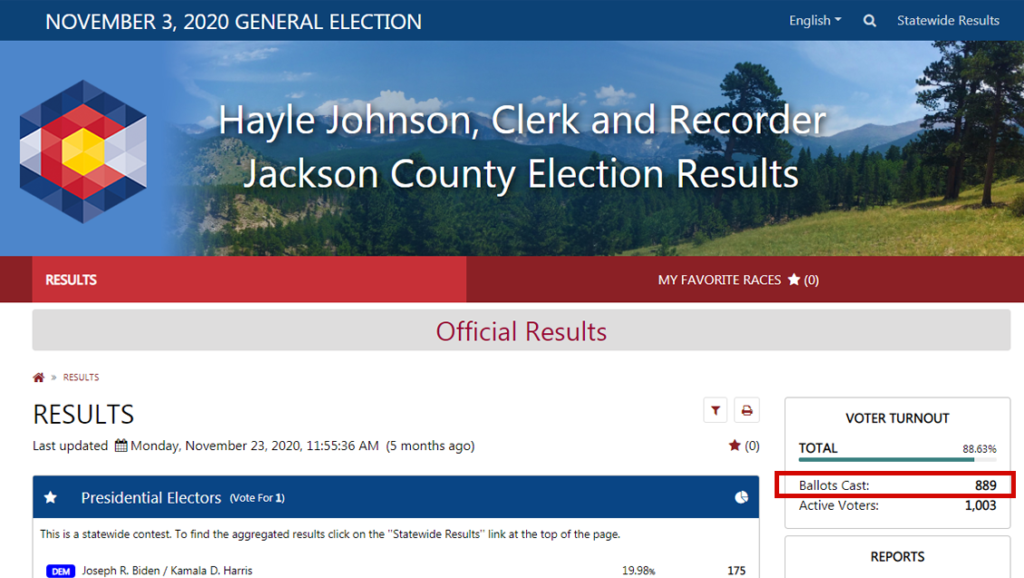
Screenshot 3
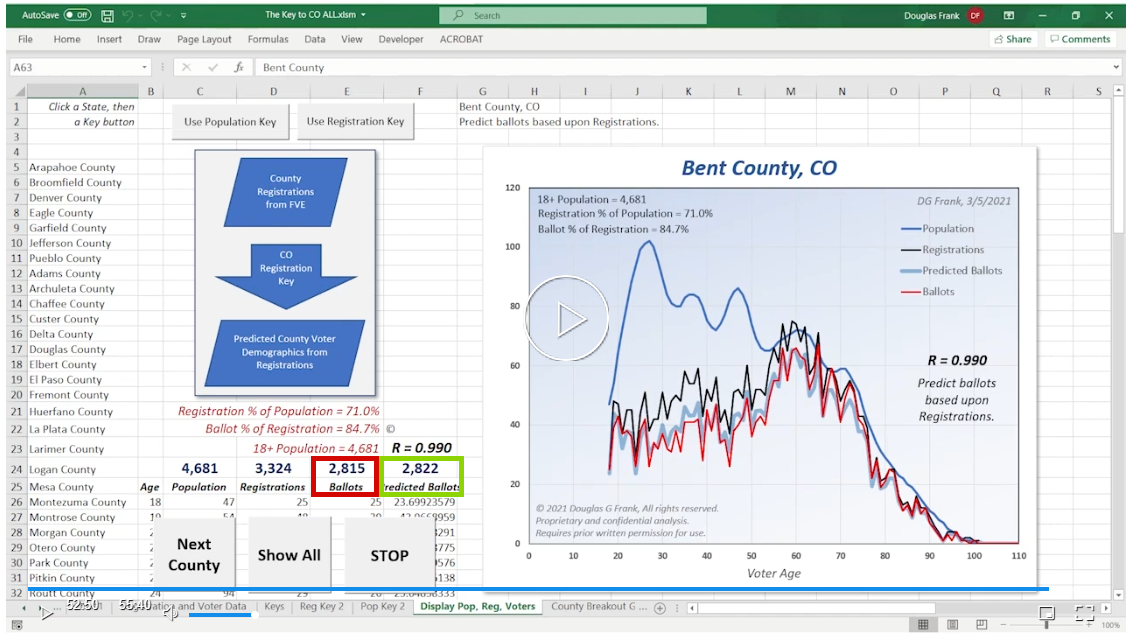
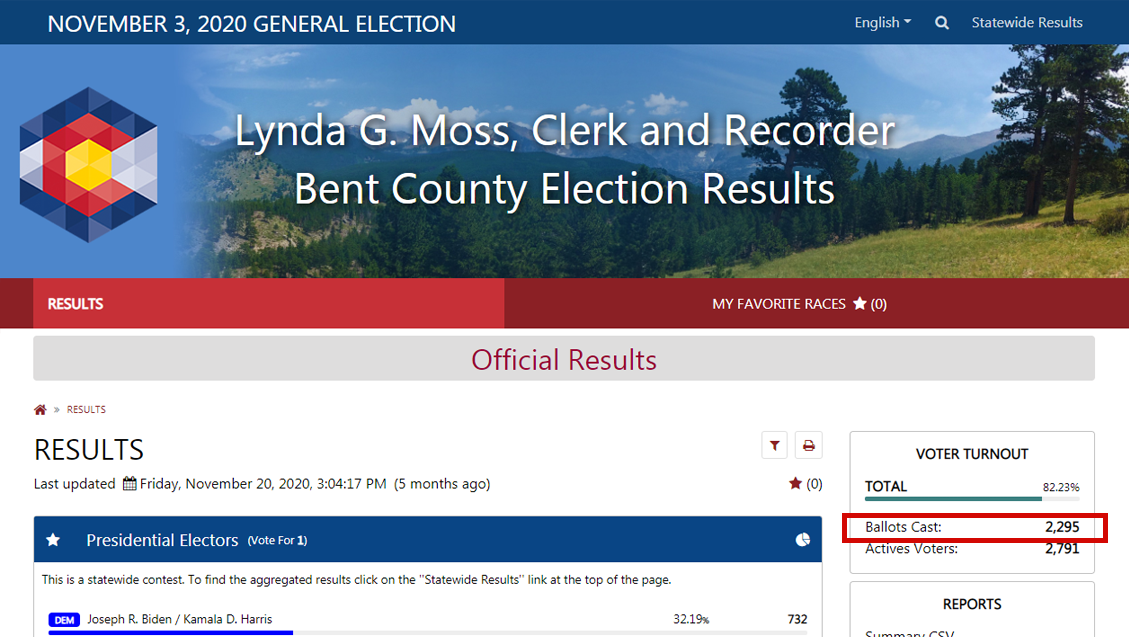
And again with Bent County. Dr. Frank claims 2,815 ballots were cast when in reality it was 2,295. This is a 22% error not just in his estimate, but in the data he’s basing his analysis on.

Screenshot 4 
Screenshot 5
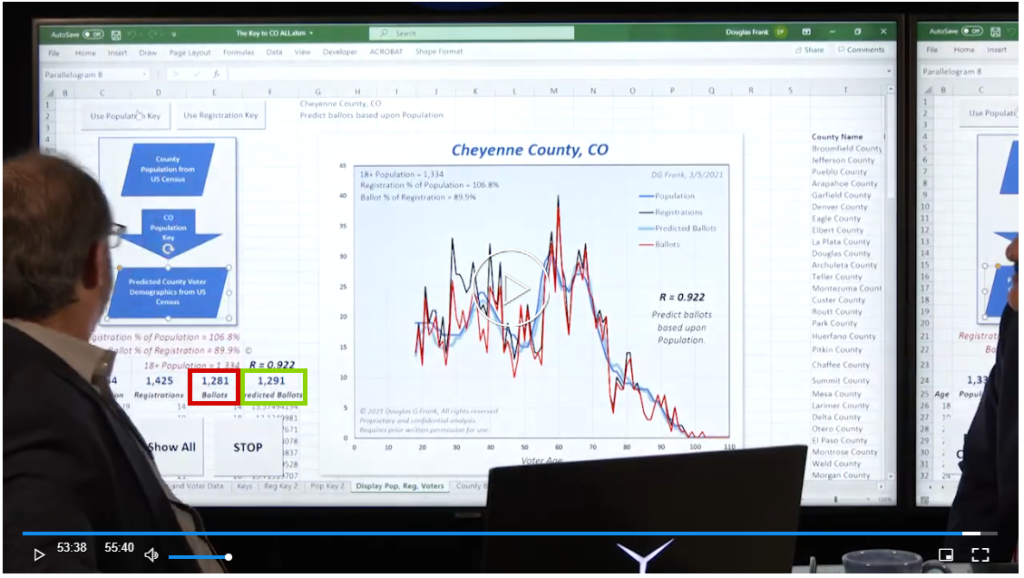
Cheyenne County — he claims 1,281 ballots were cast when it was actually 1,146.
Screenshot 6 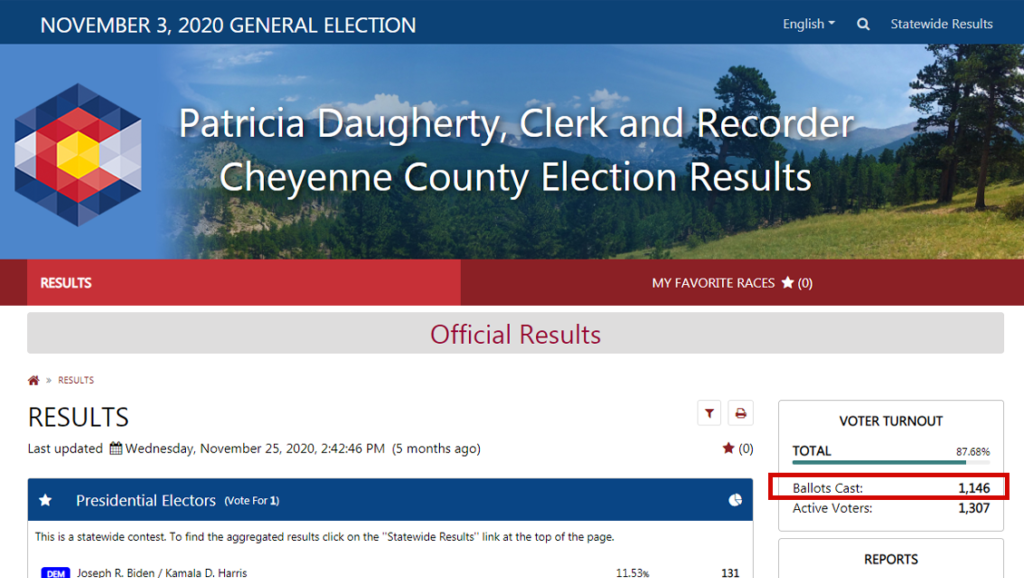
Screenshot 7


Every single underlying datapoint he’s relying on is wrong. The problem with the analysis he presents doesn’t stem from some trick of math or algorithms or theory. The data is just bad. And therefore the analysis based on that data must be as well.
Like they say “garbage in, garbage out.”
Even more bizarre is the fact that even the raw data Dr. Frank supposedly used (sorry the host removed the link after this blog was published) for his analysis doesn’t produce the figures he has been presenting.
The second act in this drama is all too predictable as well. It goes something like this; “Oh but Ben, we corrected the data and the analysis still holds!”
And that right there is what should really scare anyone who understands data. The fact that the analysis would work on fake data, real data, any data you give it, is proof that it never had any interpretive power to begin with.
Misrepresenting the Census
The “Census” data that Dr. Frank displays in the above graphs does not come from the real Census. The data that he shows is his own interpretation of the numbers. He is applying his own smoothing method to the 2010 Census to get estimates of population by age because the census does not produce this level of detail in their data.
The census does not produce this level of detail in their data.
Smoothing out the data isn’t so bad in itself. However, he fails to account for both inter and intrastate migration. People moving within and between states is a huge population driver and, as I’ve discussed before, accounts for almost half of Colorado’s voter registration growth in recent history.
As some observant commentators pointed out, this means that the “fraudsters” in Dr. Frank’s world weren’t using the Census data to control the registration as Dr. Frank claims. But, rather, they must have miraculously stumbled upon and used Dr. Frank’s exact same method of smoothing out the census data by age to perpetrate their fraud. That strikes me as pretty unlikely. …unlesss… he as in league with them from the start!
Once again, even if you give Dr. Frank the benefit of the doubt we still have some problems with his assertions.
Census Methodology
In thinking about the claim that some counties appear to have more registered voters than census population start by asking yourself this: why do you think that the Census data is innately more accurate than the voter file?
Wouldn’t a disagreement between voter registration and census data point to the census data being incorrect and not vice versa? After all, every voter registration record is tied to a named person whereas the Census is just a glorified poll.
You can read the methodology for the ACS survey here: https://www.census.gov/programs-surveys/acs/methodology.html
The more interesting elements are in the covered geography and sample size sections.
The Census doesn’t even produce real estimates for most counties in Colorado every year. As you can see from the Geography section of the above link, they only conduct polls in geographies with populations greater than 65,000 annually. That’s only the 12 largest Colorado Counties.
When you look at the Census data and see that Routt County had a population of 25,072 in 2019 what that actually means is that at some point between 2015 and 2019 a few people in Routt County answered the survey and they just used an algorithm to estimate the population for all those years in between.
Right off the bat, this is a problem for Dr. Frank because he’s using 2020 registration data and comparing it to population estimates that are guesses from 10 years in the past. If Dr. Frank were to compare apples-to-apples in the case of Routt he would need to be using a total registration number that’s about 20% lower than the 2020 registration totals he’s using. In a high population growth state like Colorado, this is a particularly bad problem.
The other interesting thing you can find on the methodology link is the sample sizes for each state. You can see that the sample the Census used for Colorado is around 30k surveys. That’s pretty good for a whole State. If that was all done in one shot that’d give a margin of error of less than 1% for total population. Unfortunately, when you consider that the Census only surveys the largest 12 counties every year that leaves a lot of margin for the small counties.
To return to the Routt county example, even if the Census got a representative sample of those 30k responses to come out of Routt in a single year, their best recent estimate would still be something like +/- 2,000 people for Routt County alone. Really little more than an educated guess.
In short. If you compare the real Census population estimates and voter registration for the same point in time registration, doesn’t exceed the population estimate’s error margin in any counties I’m aware of.
Presentation Inconsistency
Anyone who has actually watched Dr. Frank’s presentation on this will note that he’s careful never to show the actual equation that he uses to produce his turnout estimates. The equation is central to his claim because he states that a single “6th order polynomial” can reproduce the turnout rates by age for each county. You can watch his explanation here. This would be damning because it suggests that some ratio describing voter turnout behavior is identical across all counties. But Dr. Frank’s own presentation shows this isn’t even true. The graphs he shows clearly use different equations for each county.
Consider his claims for Eagle and Park County:

Screenshot 8 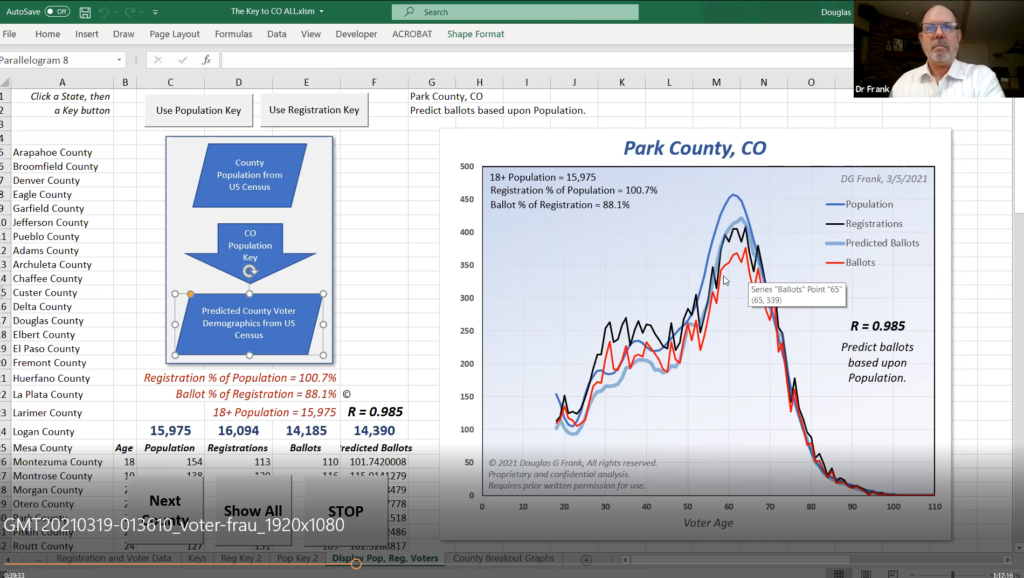
Screenshot 9
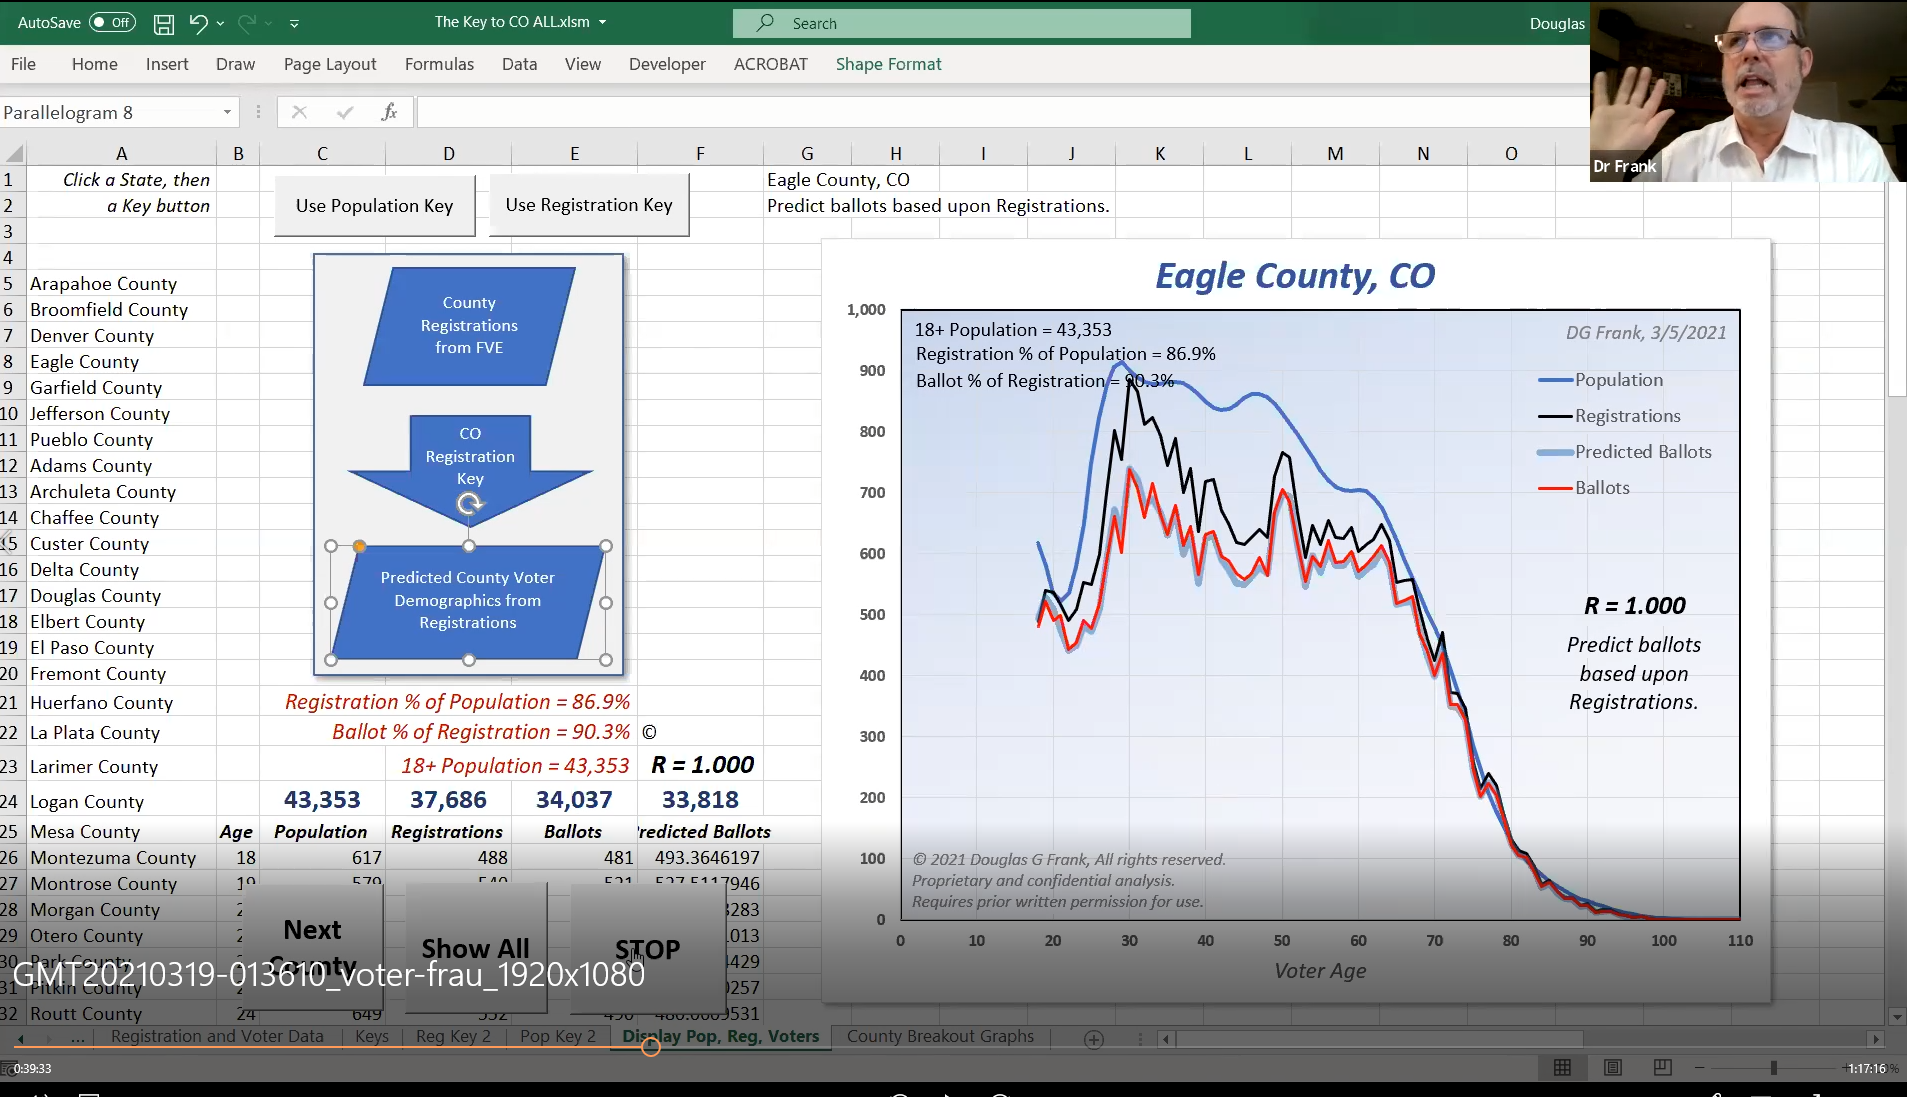

Does the distribution and gaps between those lines look the same to you? He keeps most of the data hidden but we can see that in Park he’s showing 18 year-old registration of 113, Ballots Cast of 110, and his prediction is 101.7. In Eagle County he’s showing 18 year-old registration of 488, ballots cast of 481, and his prediction is 493.36. As he explains, his “6th order polynomial key” only produces one number as an output and that number is the key to convert registration to ballots cast. But in his own presentation, he doesn’t show a single consistent ratio of… anything to anything. He’s clearly using different ratios for each county which would have had to been produced by two different “6th order polynomials.” He’s lying about how his forecast is derived.
The below table shows the numbers taken directly from the above screenshots. Next to those, I’ve calculated the ratio for just about every number to every number. Dr. Frank claims that the ratio of… something… should be the same across counties. But, as you can plainly see in the below table not a single one of these number relationships matches.

Deliberate Deception
The most troubling piece of all this is that it seems clear that Dr. Frank arrived in Colorado knowing that his data was bad and intending to present it anyway.
I’ve thoroughly documented the fact that I made Dr. Frank and his crew aware of the errors in his data two weeks prior to his April 23rd Colorado tour. However, the account of events from his supporters is that he didn’t even bother to begin correcting his data until this blog post was widely disseminated.
Why would Dr. Frank present data that he knew was false?
Claim: Turnout by Age was Uniform Across Counties
Dr. Frank is not claiming that the turnout rate (ballots cast / registered voters) is the same by age across counties. I initially thought that was the point he was making because many people who follow him more closely than I told me this is what his work showed. If you listen to his explanation it does sound like he’s saying turnout rate by age was uniform across counties. However, what he’s actually doing is more complicated so I don’t fault him nor his listeners for the misunderstanding.
For those who do think that Dr. Frank is claiming the turnout rate by age is uniform across counties, I leave this section:
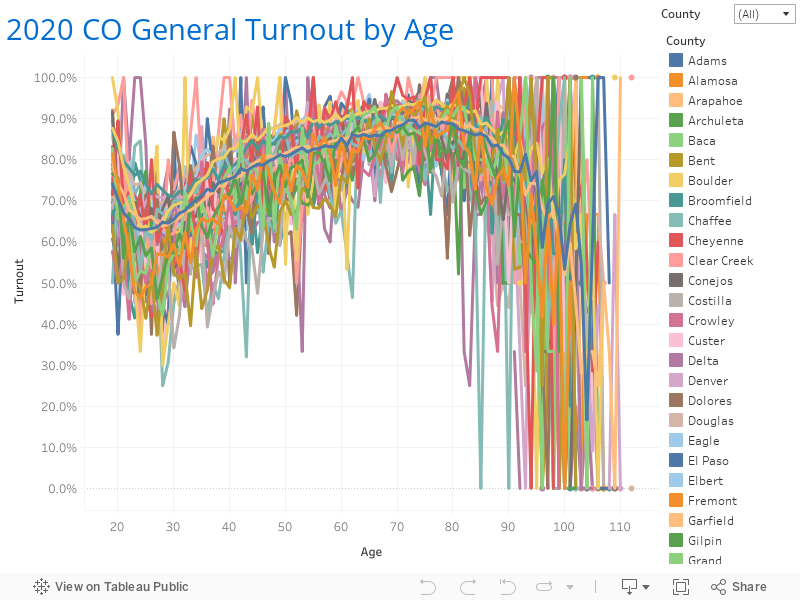
This is quite simply not true. And it’s easy to prove this isn’t the case. Below is a graph you can play with that shows the turnout rate by age, by county in Colorado’s 2020 General Election. As you can see, there’s a ton of variation across counties. Just as we’d expect.
All of the data and code to recreate this graph are available here. And if you don’t believe me, well you can always get your own data from the Secretary of State here.
Data
- Raw data Dr. Frank used for CO his analysis. (Sorry, it was removed by the host after this blog was published)
- Raw data Constellation used for CO registration, ballots cast, and turnout.
- Python code Constellation used to compile data for turnout by age graph.
- Colorado Secretary of State data request page.
Excellent articleI. One quick check though is simply the number of extrema. Being generous to “Dr” Frank, I get at least 19 extrema in one of the screenshots. Somehow he got this out of a 6th order polynomial???
Here are the updated links
Ballots 51,613
https://lindelltv.com/mike-lindell-tv-releases-irrefutable-election-theft-proof/
Ballots 47,103
https://drive.google.com/file/d/1eDdWLf0mUKPIhxZAnmpCH6jed0XvPazX/view
Howdy Tom, actually what I said was that census data doesn’t contain “by year” granularity for age data. It’s in 5-10 year groups like the data you’ve shared. This is relevant because it makes Dr. Frank’s claims even more outlandish. Not only would he have had to discover a secret election stealing algorithm (using Excel) but he would have had to use the exact same method of disaggregating the age data as the fraudsters did. That’s either an extraordinary coincidence… or he was in on the fraud to begin with! …or he’s just jerking a bunch of well-meaning people around.
You indicated there is no census data based on age. Why not use this: https://www.census.gov/data/tables/time-series/demo/popest/2010s-counties-detail.html
Got it!
Howdy gmckca, So your thought is that if Dr. Frank’s methods work on elections that we know (or assume) to have been secure then it shows that it’s meaningless? But I’ve demonstrated a much more powerful example of that above. All of the data presented for his Colorado actuals is verifiably, and irrefutably wrong — meaningless. And yet, his analysis worked on a bunch of completely random data. That’s because his methods will work on ANY data set. If you take the average of a bunch of numbers, of course, the average will be correlated to those numbers!
Wouldn’t a Gold Standard of (dis)proof of Douglas Frank’s theory be to do a similar analysis of elections in 2016, 2012, etc., and see whether the theory holds (in the sense that such a “hacked” pattern wasn’t apparent in those elections)? Although I read somewhere that certain conspiracy theorists claim that elections have been “hacked” by the same actor(s) as far back as 2000(!).
Today the 2020 Census came out. I thought it would be interesting if you compared Dr Frank’s estimations using he “smoothing” technique on the 2010 Census, with the actual hard data from the just released 2020 census, and see how far off his guesses are.
You did a great analysis here, by the way. Your effort is really appreciated.
Hey Ben, thanks for taking the time to do this analysis. Maybe if you renamed your post to “How the election was stolen’ instead of “Dr. Frank’s analysis is wrong” would make you more popular with Republicans as disagreeing with Dr. Franks analysis makes you a Rhino and apparently a Communist a$$. When did it became wrong to disagree with an extraordinary claim when the extraordinary proof of that claim has not been shared? This really should just be a strait proof if it really is proof of fraud. BTW – Mike Lindell’s is offering $5 million to ‘any “cyber… Read more »
PS: Can you please repost the url of Dr. Frank admitting his data is bad? I reviewed the page and could not find it.
Note that the election results aren’t directly available from clarityelections.com: https://results.enr.clarityelections.com/CO/Broomfield/
Where did you get this pdf? This link is to a google drive, which could be anyone. https://drive.google.com/file/d/1eDdWLf0mUKPIhxZAnmpCH6jed0XvPazX/view
Howdy Randy, they’re in economics, political science, mathematics, and business. However, it doesn’t take a college degree to be able to look at two numbers and see that they aren’t the same. The numbers, in this case, being those Dr. Frank presents as the “actual ballots cast” and what the County Clerks and Secretary of State actually reported.
Howdy “School of Hard Knocks Coach”, I don’t generally approve posts from those too cowardly to sign their names. However, I thought others might also share your confusion. If you review the above data links or the comments on this post you’ll see that I and others here have, indeed, replicated his work. Further, Dr. Frank is aware of this blog post and the audio of him admitting his data is bad is available in the links above too. That you believe they would ever honor a $5 mln bounty is perhaps the jumping-off point for your problems understanding these… Read more »
Ben, what are your degrees in from the University of Colorado?
Wow Ben — Looks like you’ve been blogging your little Communist a$$ off here trashing everything about those who challenge the crooked election. And it’s interesting that you trashed Dr. Frank here when you haven’t even been able to replicate his work. And YEEEEETTTT — you (and all of your little braniac yappy-chihuahua buddies) had an opportunity to go and make your POINT this week and prove your bullshit to take Mike Lindell’s ** 5 MILLION DOLLARS ** . But, I’ve been watching the Symposium for two days and I haven’t seen you on stage AT ALL.
Hmmmm … interesting.
Oh I think I misunderstood your proposal. You mean create one data set that’s comprised of counties from all over and then run it through? That’s a good idea. I only have reliable data for Colorado, myself, or I’d undertake that on all our behalfs.
Yeah, that was my point. If it’s just a trick of statistics, then it should still work when you mix various counties from differing states. The keys are directly derived from the data sets in the python code, they aren’t introduced as outside constants. Unless I missed something?
Ah, well he’s one step ahead of you there. I believe Dr. Frank has pointed out repeatedly that each “key” only works within its own state. The reason being that his whole analysis only works because the thing it’s predicting is an input to the prediction itself. That’s why it appears to break when you move across state lines.
Thanks for the quick response. I get your point. I checked those github repos and the xls file you mentioned. The sensible thing to do seems to be to test the election-fraud-ohio repo by inputting several counties from various states. If it fails to generate such beautifully predictive graphs then that would suggest its worth looking into further.
Howdy Quentin, Thanks for the thoughtful question. You are correct, we would not expect a 6th order polynomial to produce a simple ratio IF that 6th order polynomial also had six unique variables accompanying its six coefficients. If you watch some of the videos linked above, you can see that Dr. Frank is using only one variable as the input to his polynomial which, in effect, makes it a simple ratio. I believe what you’re thinking of is an equation of this form: y = ab^6 + cd^5 + ef^4 + ij^3 + kl^2 + mn + o But Dr.… Read more »
Maybe my math is a bit rusty, but isn’t the claim that “it suggests that some ratio describing voter turnout behavior is identical across all counties” erroneous here? If a 6th order polynomial is being used to generate the numbers, we shouldn’t expect there to be a simple ratio. Isn’t that the point of the 6th degree polynomial? To “hide” someone from seeing the math by just comparing two graphs?
Howdy Tom, please take another, more careful, read through my explanation. The point is that the numbers Dr. Frank is using as his ACTUALS, the numbers he based his analysis on, are all wrong. Thus his analysis CAN’T be right.
Please provide the link to the Census data you describe which has the population broken out by age by year, not age range.
Wow, I’m not a mathematician and even I can poke holes in this cover story, large GAPING HOLES! First I’ll bring up is YES, US Census data DOES breakdown the population by age, it comes as a whole percentage and merely needs to be converted into a whole number. Second, Dr. Frank adjusted the 2010 census to accommodate for aging, moving and death. Once one algorithm was established he was able to extrapolate and accurately predict the outcome of each county. Third, this article does not take into account the fact that his predictions match actual vote in the election.… Read more »
Howdy Zen, thanks for taking the time to weigh in. You are correct I am saying “show me his data.” But, what’s more concerning to me is this — why aren’t you saying that too? Why does Dr. Frank never provide any supporting evidence for his claims? When we conducted the same door-to-door audit here in Colorado we found nothing of the sort. And yet, you seem willing to simply take Dr. Frank’s word as gospel. Even after I’ve shown incontrovertibly that he has knowingly been peddling false data. The real problem with all this is that the election WAS… Read more »
Dr frank says when they went door to door auditing 1600 votes , 32 percent did not even live at their respective addresses but yet still a vote was cast for them . Ben , this is all the proof anyone needs to begin auditing every county in the country . That’s the bottom line and the only math people need to hear . I know you are going to say “ show me his real data” . So ridiculous Ben
Howdy Vic, I have heard some chatter about that. I guess they do owe me $5 mln. I know Dr. Frank is aware of this blog post. Odd that no one has reached out to see about where to send my check. Or bothered to correct their verifiably false Colorado data for that matter…
I guess they owe you $5million?
Howdy Fred, Appreciate you taking some time to actually give thought to this. You almost hit it right on the head. The thing is it’s exactly as you say — it’s the AVERAGE turnout that’s little over 50%. Consider that some of these counties are quite small, though. It’s reasonable to think that maybe Dolores County does only have one resident who is say… 75. If that one person returned their ballot, you’d get 100% turnout for that county/age combination. So, it’s actually quite possible.
Howdy Bill, Actually, unlike Dr. Frank, I’m not asking you to believe me at all. All of the screenshots above are linked to their original sources so you can see with your own eyes that the data used by Dr. Frank for his analysis was inaccurate.
So, instead of believing a bunch of PhD math and computer experts, we should believe a political science major with an agenda? What happened to “follow the science?”
I’m looking at your dada in the graph above which shows 100% voter turnout in many districts. That is virtually impossible. The average voter turnout in most locations is a little over 50%. Even 90% is unheard of. What do you have to say about that?
[…] the more wary side, Benjamin Engen of the Constellation Political website says that Dr. Frank’s underlying data points for Colorado are flat wrong. As someone who […]
I’m puzzled by the claims by Gary Carter that Dr. Frank is “internationally regarded as an expert in Auger spectroscopy.” Dr. Frank has a total of 30 published papers (and about 25 abstracts or conference proceedings, which are not refereed), the most recent from 1997, and almost all from the lab of Dr. Arthur Hubbard, who in fact was an expert on Auger spectroscopy. So it would be more accurate to say Dr. Frank worked in a lab under the supervision of an internationally well known expert in Auger spectroscopy. It is puzzling that such an expert has not been… Read more »
Mr. Ben with all due respect your links go to clarity elections and your own databases are resources. I think you may be limiting your scope by doing so in order to compare the data with Dr. Frank’s.
Credentials are of little value if you base your whole analysis on bad data. Did you read the above post and provided links? Or do you still believe that the data he used is somehow accurate? If so, could you elaborate on why you think that?
So 12 years in politics makes you an expert in math and science. I believe a person with a B.A. in Chemistry, a doctorate at the University of California, part of the Ohio Eminent Scholar program, a Ph.D. in Surface Analytical Chemistry with over 50 scientific publications, and internationally regarded as an expert in Auger spectroscopy may know what he is talking about.
Is it your contention that Dr. Frank did not present inaccurate data in the video described above? Did you read the post and supporting links before commenting?
There is a book written by Sharyll Attkisson called Smear. I believe you are a follower of this group and are being paid to smear Dr Frank. After all you are a politician.
You can work the equation backwards if you have the registration data and ballots cast for a single county.
Using the polynomial Ax^6 + Bx^5 + Cx^4 + Dx^3 + Ex^2 + Fx + G.
Where each age group will have a unique coefficients/keys of A,B,C,D,E,F,G
The claim is, using these keys with voter registration data of any county in that state can 99% predict ballots cast.
Howdy Nick, do you have any views on the actual facts presented above? Or are you simply suggesting that because you admire Dr. Franks creditianls SO much that it doesn’t matter that his analysis is based entirely on bad data? That it will still somehow be accurate?
Where are your credentials compared to Dr. Frank. Your credentials look very weak. So you’re a politician that went to college and you’re smart enough to debunk this. He’s not going to present his found algorithm until it is submitted into a court filing. Stop the coverup. After the Arizona Audit you Marxist propagandists will be reveal. Dr. Douglas G. Frank Dr. Douglas Frank holds a Ph.D in Surface Analytical Chemistry from the University of Cincinnati. Dr. Frank is an internationally recognized scientist with over fifty scientific publications. In 1990 Dr. Frank discovered and invented a technique for creating three… Read more »
Howdy Robert, thanks for the thoughtful comment AND for your GitHub link. This is HUGELY helpful. So the claim isn’t that the turnout rate, by age is uniform across counties. It’s that the ratio of turnout rate by age to county total turnout is uniform across counties? Am I reading this part of right? “key = [voted[i] / registered[i] / overall_turnout for i in ii]” It looks from your code like you even have this setup to perform the same analysis for different election years? Were your findings the same for each election year? Lastly, do you believe this math… Read more »
Howdy lotario, you may have missed it if you were skimming (which I wouldn’t fault you for) but this whole post is one giant request for reproducible results. If you can take the time to locate/download the data, divine Dr. Frank’s methodology, and write the code to reproduce it, surely you can take the time to share with us the link to your data and code. Or you can email it to me directly and I’ll host it for folks reading this blog. Ben@ConstellationPolitical.com
I haven’t time for all this pedantry, but I can assure you that I obtained similar results as Dr. Frank for OhiO using (1) Downloadable data from the official state web page (2) the same key (6- order polynominal) for all of its counties. My code can be obtainable by request.
Howdy David, thanks for the comment. I certainly wish more people would make the effort to explore the data themselves as you have. However, you’re making a common mistake. “Ballots Cast” and “Votes Cast” are not the same thing. By treating them the same you’re making the assumption that every voter votes in every race. That just isn’t so. There’s plenty of people who skip various lines on their ballots for whatever reason. As such, the vote total for any race should always be less than the total for ballots cast. If that wasn’t the case… Well that might be… Read more »
This is hilarious. The author’s VERY FIRST example is highly flawed. Why? Because Broomfield county’s OWN WEBSITE… the one referenced… has THE WRONG TOTALS BASED ON THE MATH!!! 45,372 votes cast for President… NOT 46,632. Add the totals. Here is the website link. https://results.enr.clarityelections.com/CO/Broomfield/105984/web.264614/#/summary
Too bad the author never learned to count.
Either you are being very deceptive or you do not understand his analysis. Here are some independent reproductions (in Python) of Frank’s work, and it is as he says: https://github.com/rlee32/election-fraud-national (You will have to visit a repo for each state). I am leaning toward ‘you do not understand his work’ because of your argument using the 2020 Colorado Turnout plot. We do expect some noise in the raw plot, because there are many counties with low populations, where differences of 1 can make a large change in morphology, as with the older age groups as we especially see in your… Read more »
k k, that observation is so sharp it got a literal LOL out of me. You’re dead on I think, listening to it again now he pretty clearly suggests that the fraudsters would have to be doing the exact same manipulation that he is.