 No, young people don’t vote
Summary
Young people don’t vote.
Voters under the age of 46 were all underrepresented.
Voters over the age of 46 were all overrepresented.
The Numbers
The Colorado Sun‘s John Frank covered a report from Democrat Rick Ridder on Colorado political myths that were busted in this cycle.
Most of them were fairly inconsequential, but one of these claims directly makes my life more difficult every cycle so I’m going to clear this up right here and now.
Young people don’t vote.
Here is the, supposedly, debunked myth from the Sun’s piece:
6. “Younger voters don’t vote.”
The post-election report found 44 percent of the 2018 voters were under age 50 — a historic high, wrote Ridder and Williams. Entering the race, they added, this age group was only expected to reach 40 percent of total voters, based on an assumption that midterm elections skew toward older voters.
Add one more to the list …
In a separate post-race study for his Republican clients, Flaherty found a similarly large number of younger voters.
I don’t want to get into a semantic debate about who’s young, so I’ll just make a few observations and let you decide for yourself.
Let’s start by looking at how Colorado voter registration breaks out by age.
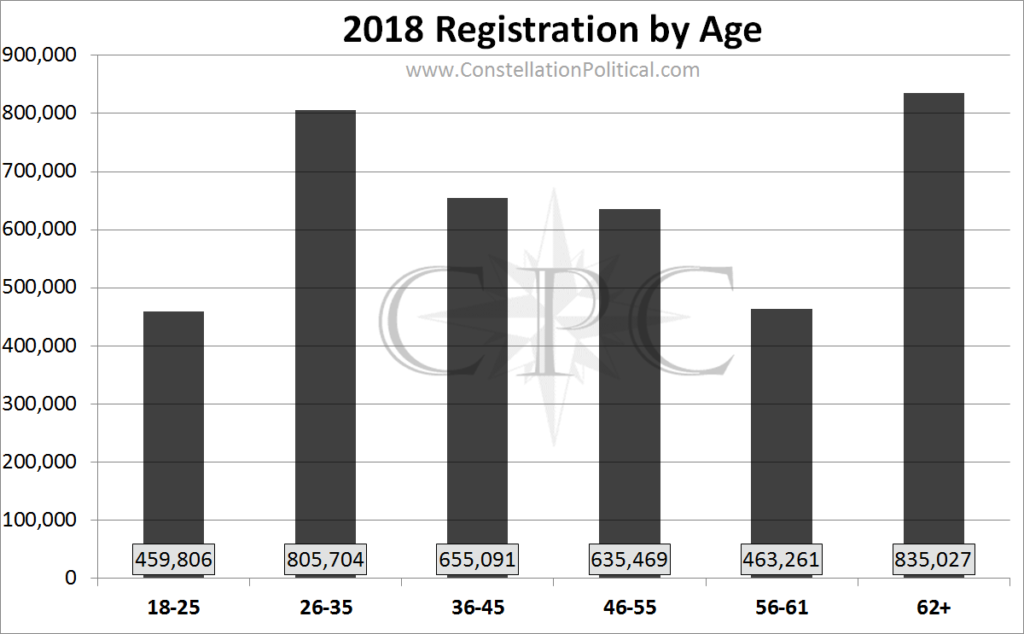
This is a simple graph. Registration by age range. The largest group of voters in the state is those over the age of 62. The second largest group, by a thin margin, is voters ages 26-35. On a percentage basis voters in the 26-35 bloc make up 21% of all registered voters in Colorado.
Now let’s take a look at who cast ballots in this 2018 Midterm.
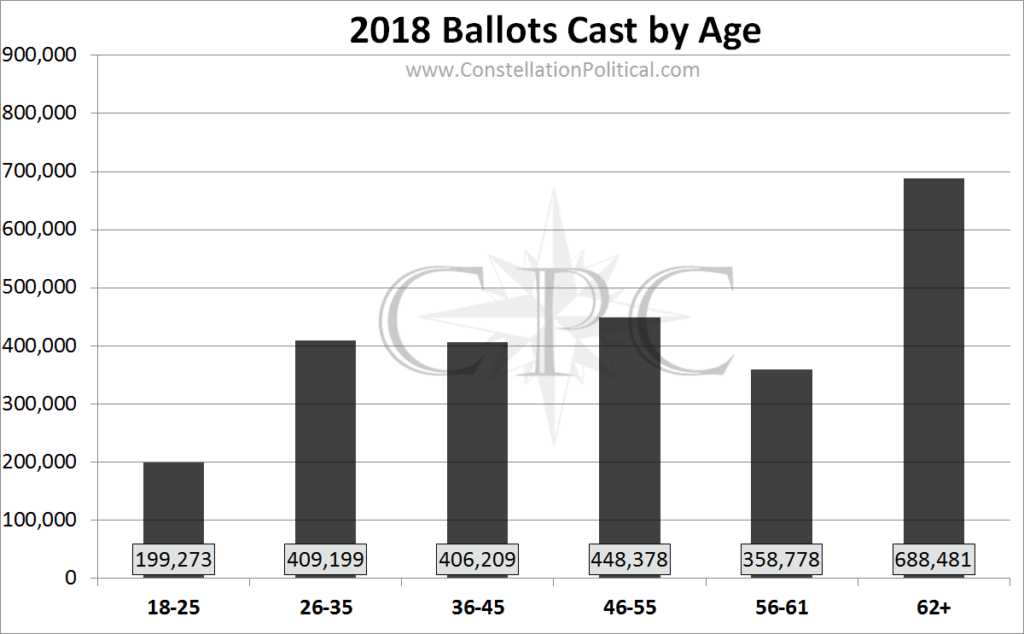
Despite being the second largest bloc of voters in Colorado, the 26-35 year olds were the third largest bloc of votes cast. Despite representing 21% of the registered voters, they only accounted for 16% of ballots cast. A five point underperformance.
If we break this out into percentages you can see the underperformance for each age group.
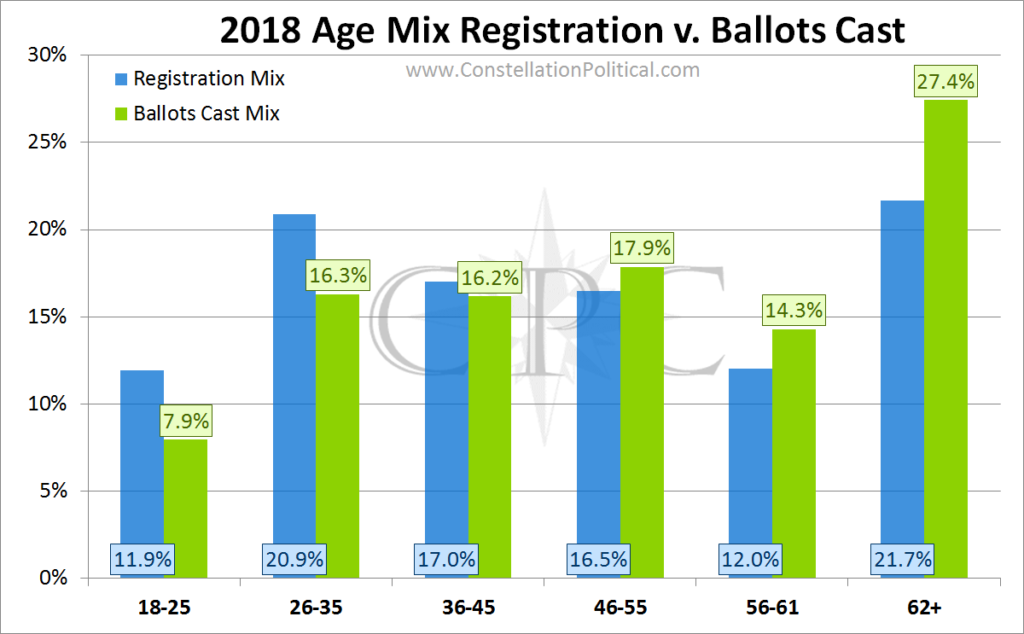
The blue bars in Graph 3 show the percentage that age group represents of all registered voters. The green bars show the percentage that age group represents of all ballots cast in 2018. If you subtract the blue numbers from the green numbers you can see the degree to which that age group was over/underrepresented in 2018 voting.
Voters under the age of 46 were all underrepresented and those over the age of 46 were all overrepresented.
That doesn’t seem like young voters turning out to me.
In support of their claim, Ridder and Williams cite the fact that 44% of the ballots were cast by people under the age of 50. But, 50% of the people registered are under the age of 45!
You decide.