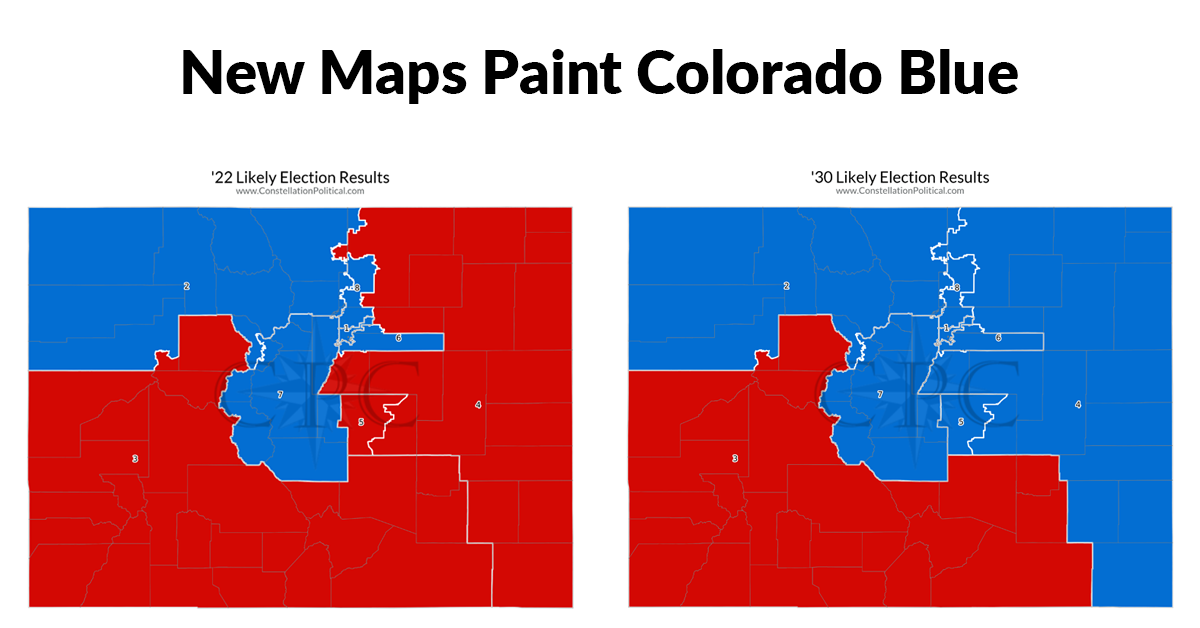
 New Maps Paint Colorado Blue
Updated 2021-10-15 to reflect the “Final Approved” Congressional Map, and “Final Approved” State Senate and State House Maps
The Final Approved maps produced by the Colorado redistricting and reapportionment committees would result in permanent Republican minorities in all legislative bodies.
Congress 2022 Result: 3 Republicans, 5 Democrats
Congress 2030 Result: 1 Republican, 7 Democrats
State Senate 2022 Result: 15 14 Republicans, 21 Democrats
State Senate 2030 Result: 6 Republicans, 29 Democrats
State House 2022 Result: 25 24 Republicans, 40 41 Democrats
State House 2030 Result: 14 13 Republicans, 51 52 Democrats
Maps
Interactive versions of the maps for Congress, State Senate, and State House can all be accessed HERE. The checkboxes on the left allow you to control which maps are being displayed. You can easily locate districts by searching for them in the top search bar. Just type “District 7” and select the option that corresponds to the map you’re interested in.
Colors denote the lifetime competitiveness of a district. Purple indicates a likelihood that the district will change hands at least once in the next decade. Red or Blue indicates that the district should remain in that party’s control.
Congress
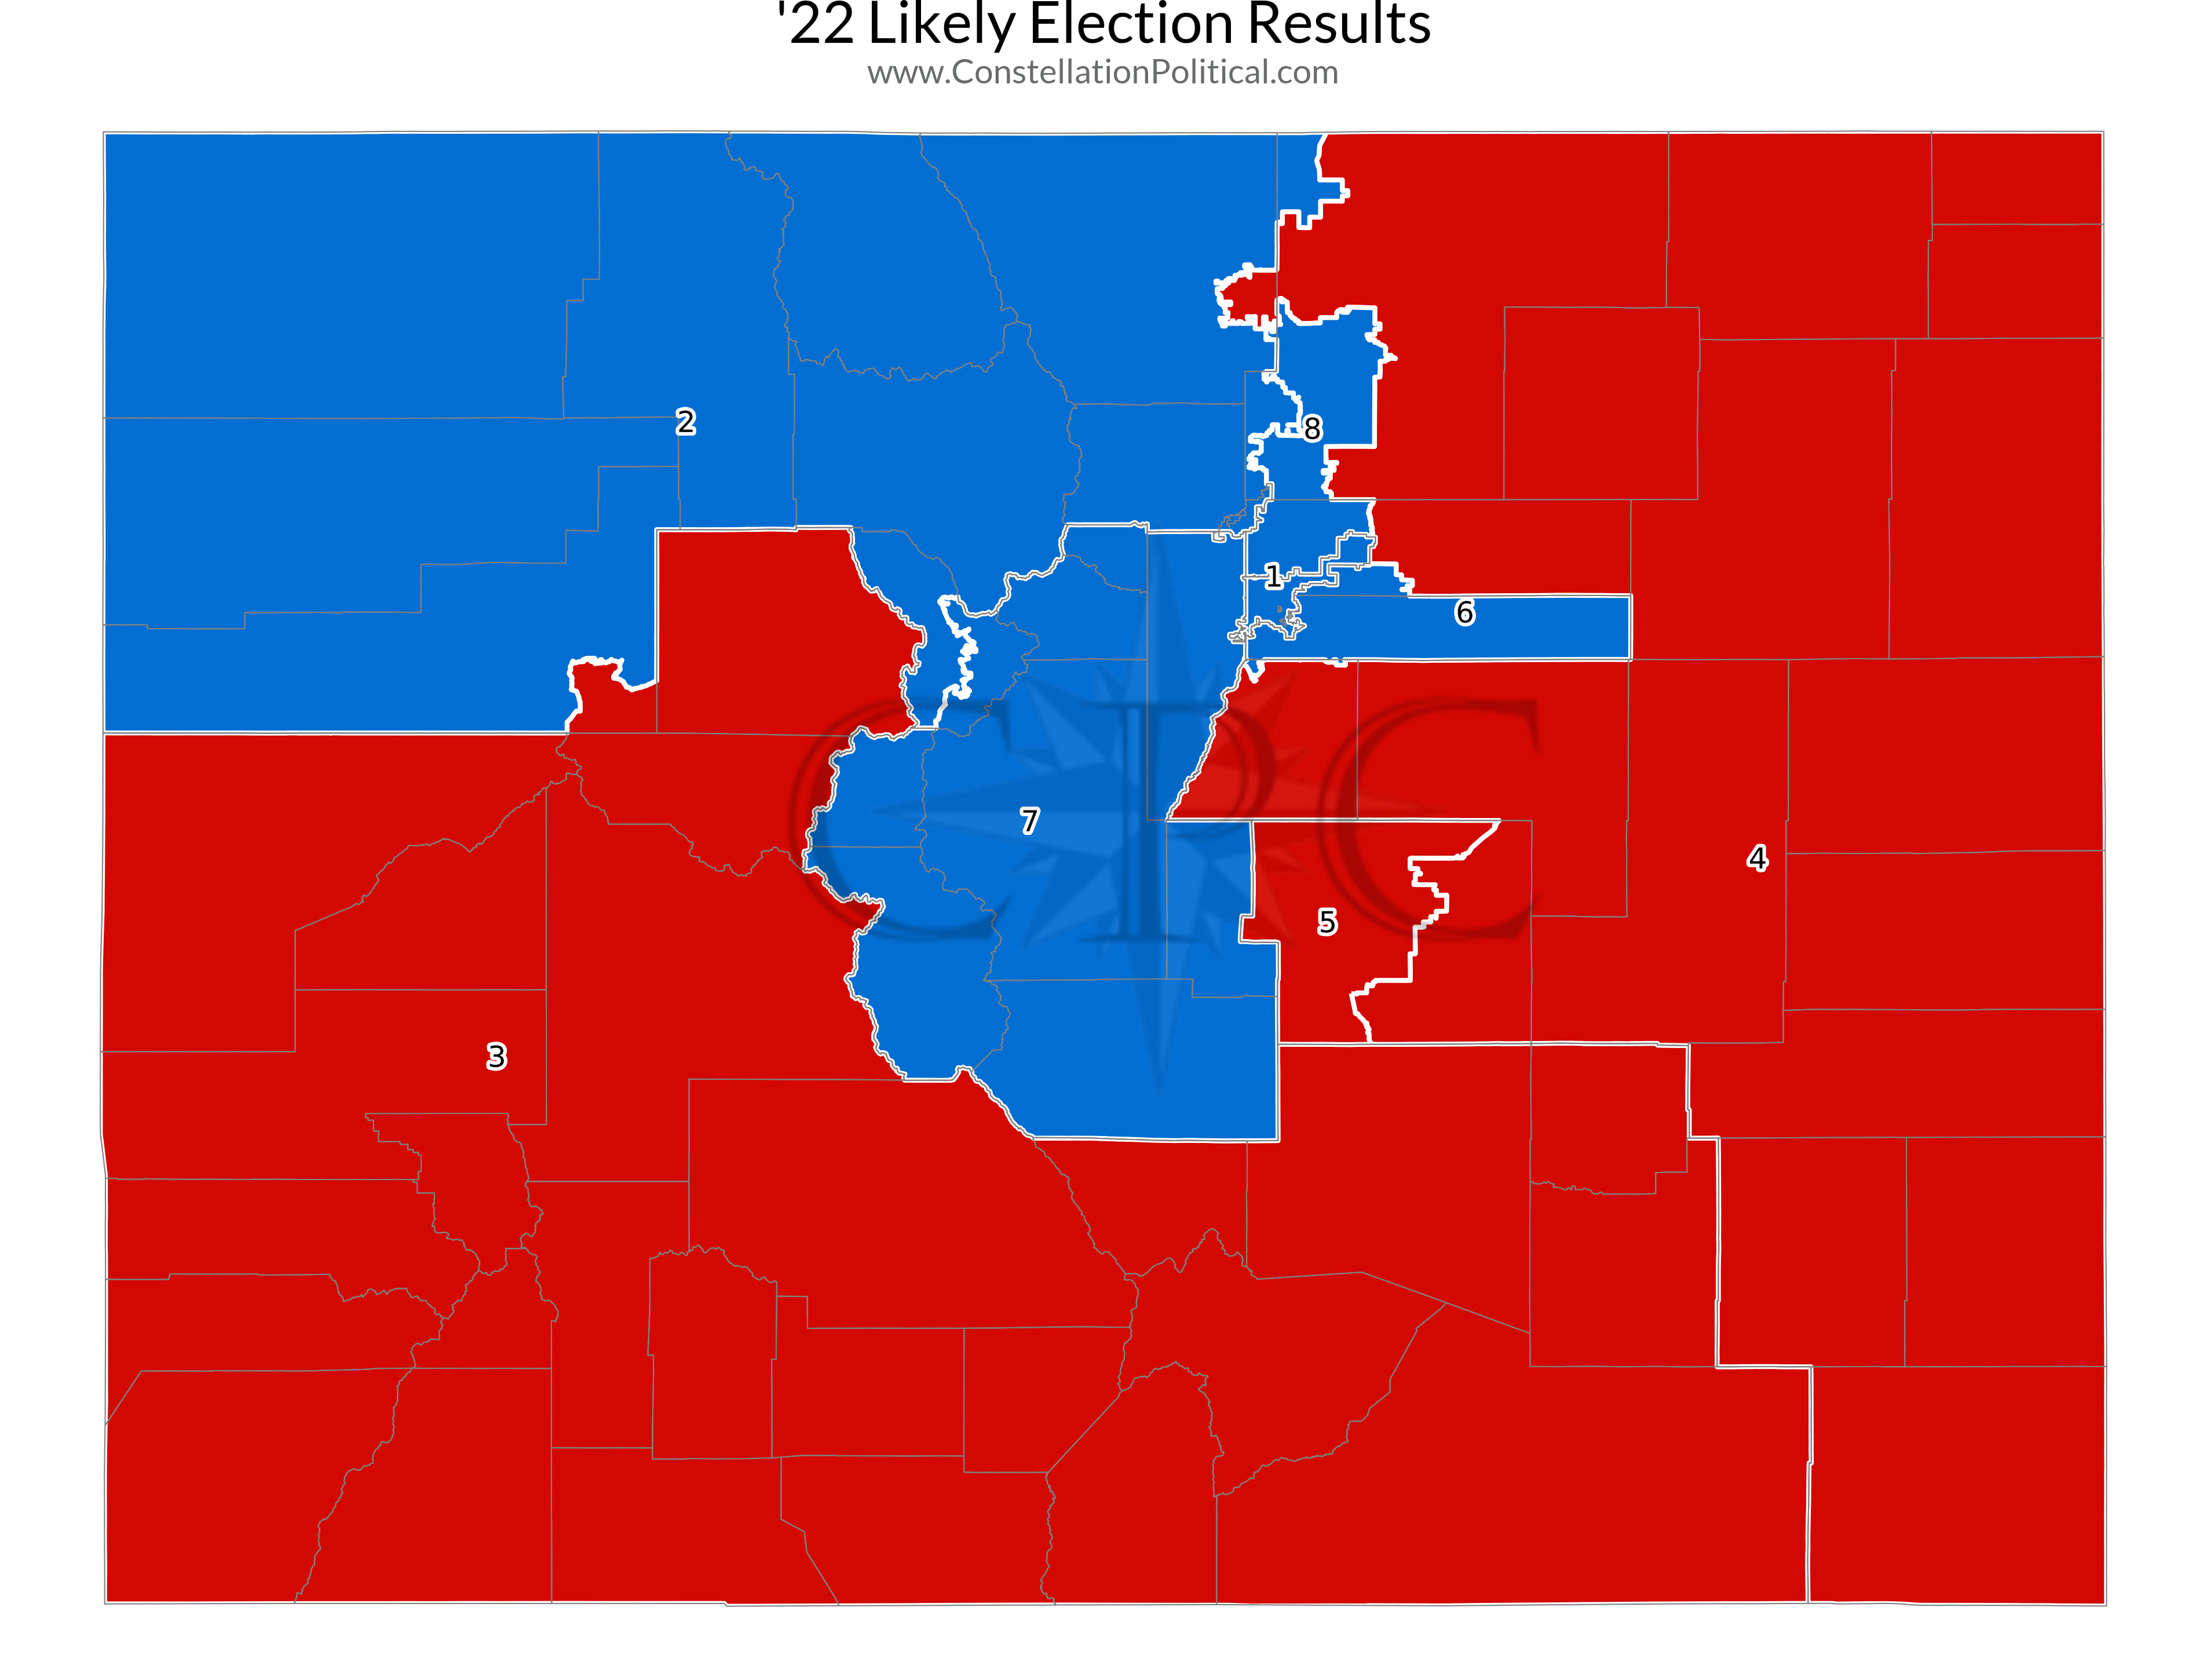
2022 Result: 3 Republicans, 5 Democrats
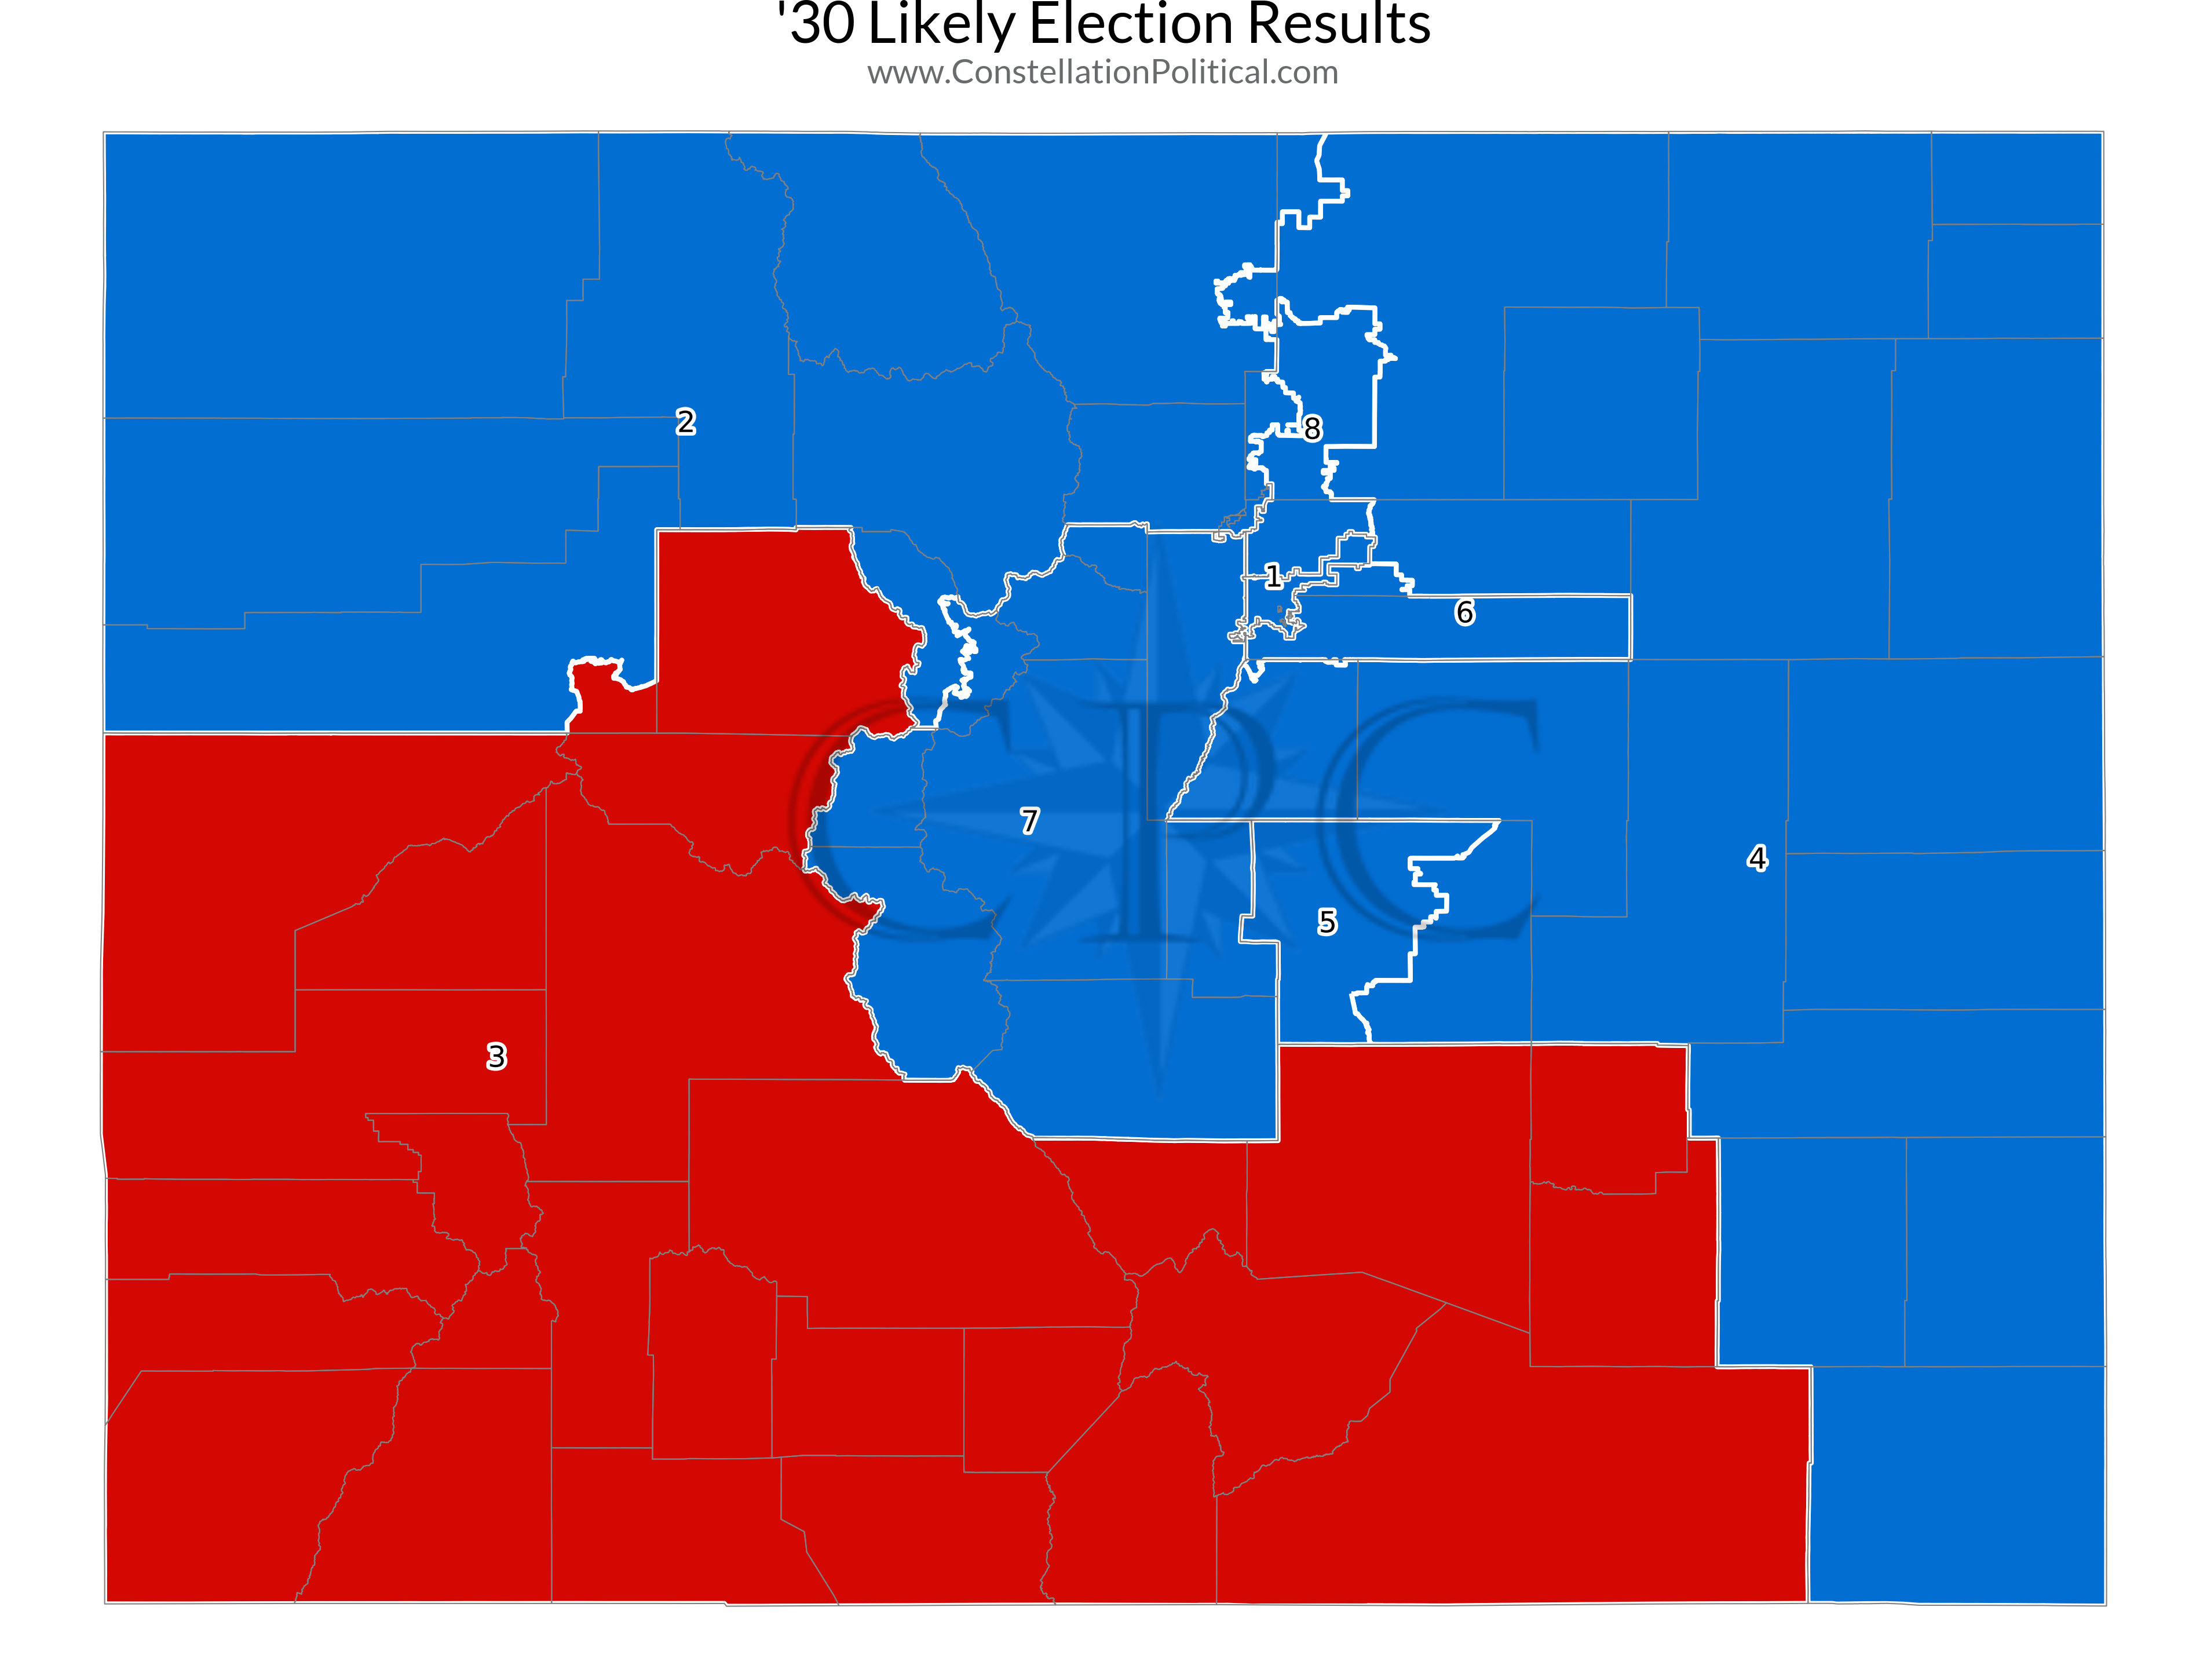
2030 Result: 1 Republican, 7 Democrats
The “Final Approved Map” produced for Congressional districts represents an improvement for Republicans over the “First Staff Map.” While the end result is the same, it delays the flip in CD-4 until 2030.
In 2022 the most likely outcome under the “Third Staff Map” is that Republicans win three Congressional seats (3, 4, & 5) and Democrats win five. This outcome would represent the high-water mark for Republican Congressional performance over the next decade.
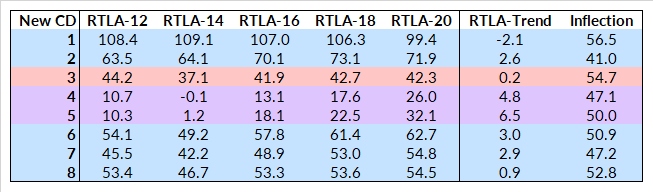
Districts 1, 2, and 6 are clearly drawn to favor Democrats. Districts 4 and 5 are clearly drawn to favor Republicans. District 3 leans Republican and looks likely to remain so. I’ve heard that this map is supposed to include two competitive districts. My assumption is districts 7 and 8 were intended to be competitive districts. However, the starting point for these districts puts them outside the reach of a Republican candidate.
The highest Congressional RTLA that still allowed a Republican victory under the current map was 52.1 when Mike Coffman won CD-6 in 2016. In the past decade, no other Republican candidate has come near this performance. Districts 7 and 8 are already more challenging. And that’s as of the 2020 election. By the 2022 election, these districts will be four six and three points, respectively, more challenging than the most challenging environment a Republican has ever prevailed in. In other words, for a Republican to win either district 7 or 8 would require an unprecedented electoral performance by that candidate. So ask yourself, do you think 2022 will be a better year for Republicans than 2014?
More subtly, given the current trends, both Districts 4 and 5 are poised to swing to Democrats in the long run. District 4 will cross its inflection point in 2024 2030 and District 5 will cross its inflection point in 2026 2028. This means that come 2026 2030 this map would most likely result in only one Republican holding Congressional office in Colorado, in CD-3.
State Senate
First Election Result: 14 Republicans, 21 Democrats
Final Election Result: 6 Republicans, 29 Democrats
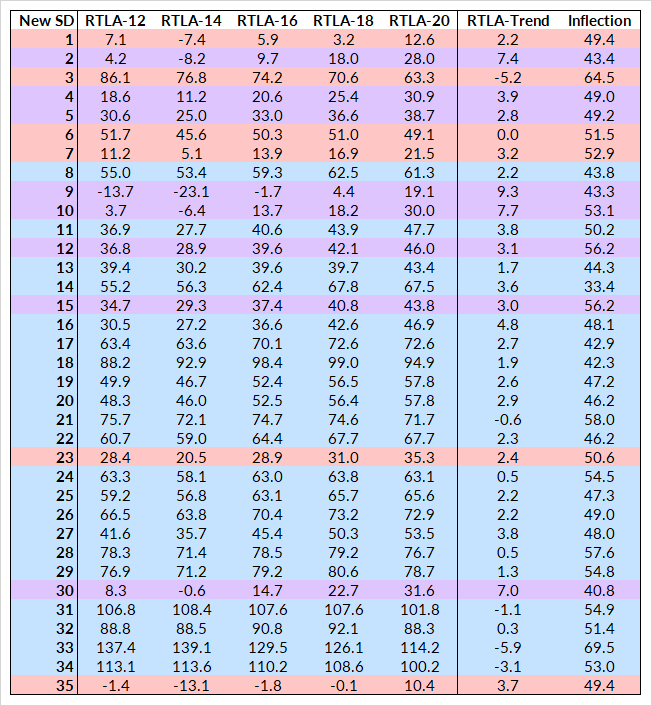
Like the Congressional map, the State Senate Map sets Republicans up for permanent minority status.
For historic context, the highest RTLA that a Republican has faced under the existing map and still achieved victory was 59.6. This was done by Sen. Priola in his 2020 re-election for SD-25. The State Senate map starts with 17 seats already above this threshold. Outside of Sen. Priola’s record-setting performance, the highest RTLA that a Republican has ever faced and still achieved victory was 44.9. That was done by Sen. Rankin in SD-8 in 2020. The “Final Approved” map for the State Senate starts 25 seats above this threshold.
Seats that are (or could be) competitive in 2022:
SD-5
SD-6
SD-12
SD-13
SD-15
SD-16
As with the Congressional map, the starting point for the State Senate map will represent the Republican high-water mark. Given the current trends in each district, this map will likely result in a 6-29 Republican minority by the end of the reapportionment cycle.
As shown in Table 2, this map features 8 seats that meet the new legal definition of competitiveness. Unfortunately, all of the flips that will make these seats competitive are from Republican to Democrat.
State House
2022 Result: 25 24 Republicans, 40 41 Democrats
2030 Result: 14 13 Republicans, 51 52 Democrats
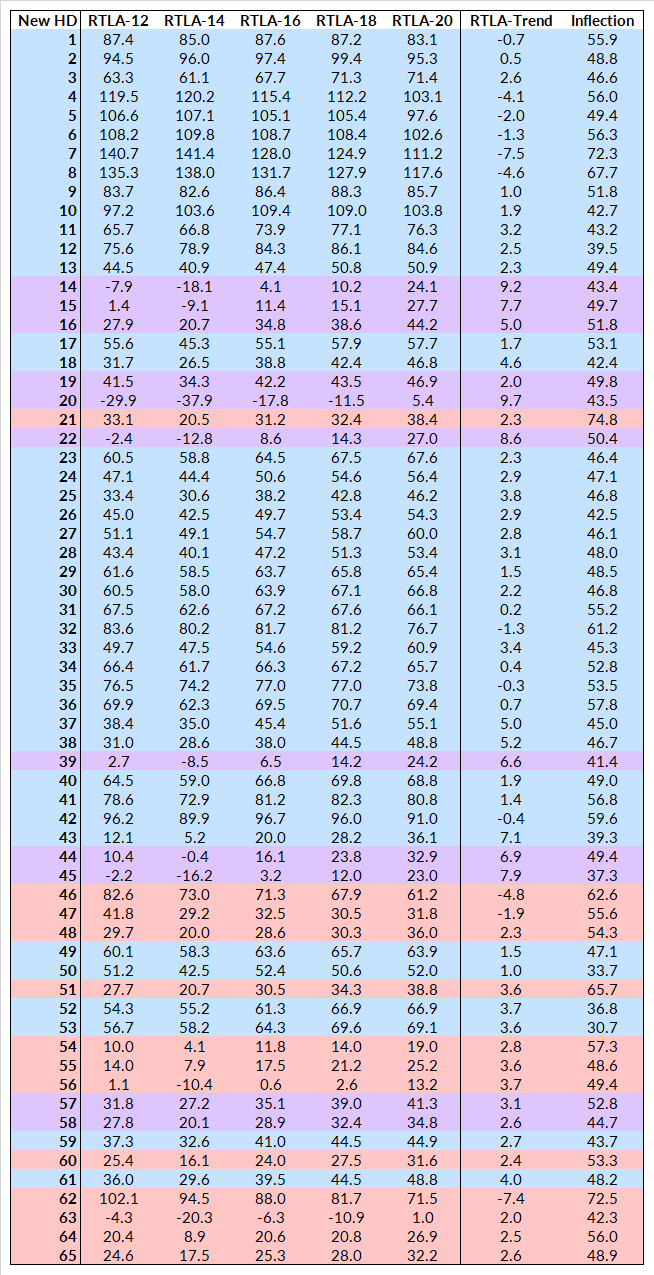
Colorado Republicans were already a minority in the State House and they would remain so under the “Final Approved” State House map. …decisively.
The highest RTLA that a Republican candidate for State House has faced under the existing map and still achieved victory has been 61.5. This was done by Rep. Navarro-Ratzlaff in HD-47 in 2012. The new map features 29 districts that start above this threshold.
In more recent history the highest RTLA that a Republican candidate for State House has faced and still achieved victory was 48.2. This was also in HD-47, this time by Rep. Luck in 2020. This new map features 40 43 seats that start above this threshold.
2022 potentially competitive seats:
HD-16
HD-19
HD-20
HD-21
HD-22
HD-43
HD-44
HD-51
HD-57
HD-59
Unlike the other maps, the State House map does feature a number of districts that are trending Republican. However, none of those with a right-ward trend are starting from a point of having enough strength for it to make a difference.
My Methodology
Let me start by saying this — this really isn’t as complicated as I make it sound.
This methodology is based on two concepts, the first is “RTLA.” This is an index that allows one to compare the competitiveness of districts across time and geography. Loosely put, this is the percentage of Unaffiliated (and other) voters that would need to vote for the Republican candidate in order for the Republican candidate to receive 51% of the total vote. Unlike most methods for assessing district competitiveness, “RTLA” is not skewed by changes in the underlying composition of the electorate such as shifts in voter registration or changes in turnout rates.
I’ll say it again: past election results are not a valid measure of district competitiveness.
This concept is discussed further in two blog posts:
The SD20 Fallacy
How Republicans Will Lose 2020 Reapportionment
The second concept is much less revolutionary — it’s the idea that the voters within a district create that particular district’s performance.
Taking these two ideas together, we can assess the competitiveness of new districts by mapping the performance of the old districts to the voters within that district. Then we assign those voters to their new districts and average the measures of performance assigned to each voter to get a sense of how the new district will perform. In essence, we’re calculating a weighted average of the performance of the old districts according to how much they overlap the new district. However, we’re using voters, not land area, to define the contribution of the old districts to the new.
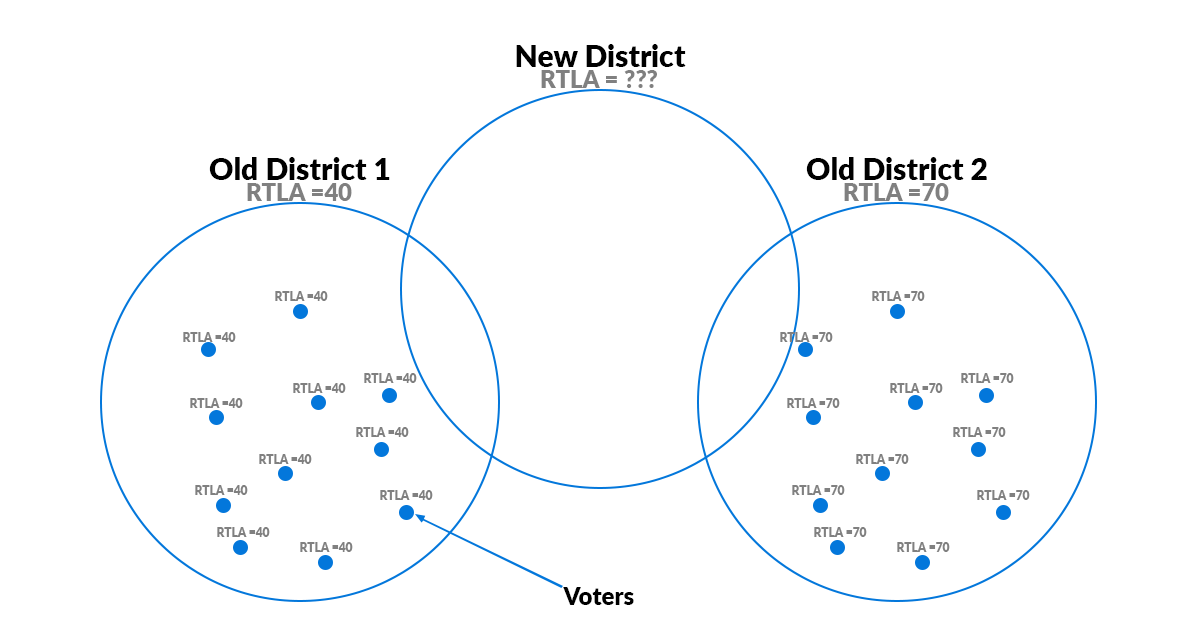
Consider Graphic 1. We know the performance of the two “Old Districts”. “Old District 1” has an RTLA of 40, and “Old District 2” has an RTLA of 70. We assign those values to each voter within the respective districts.
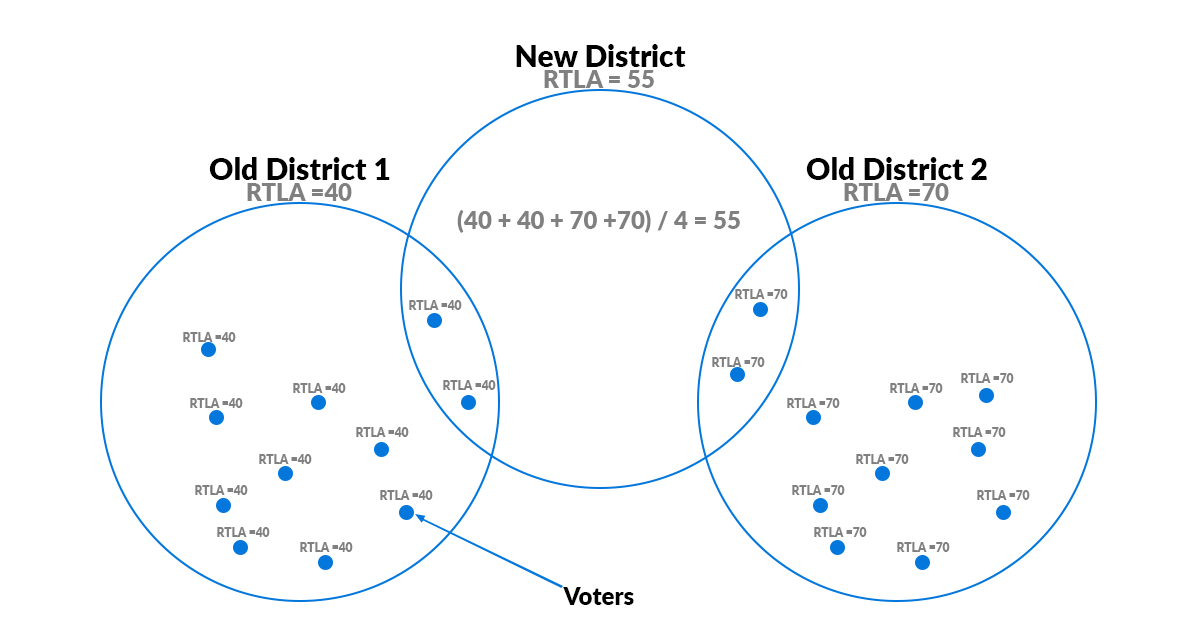
Once the “New District” is drawn we are able to identify which voters it contains. In the Graphic 2 example, we see that it contains an even split — two voters from each of the old districts. To arrive at the RTLA for the “New District” we simply average the RTLA figures for these four voters to calculate the “New District” RTLA of 55.
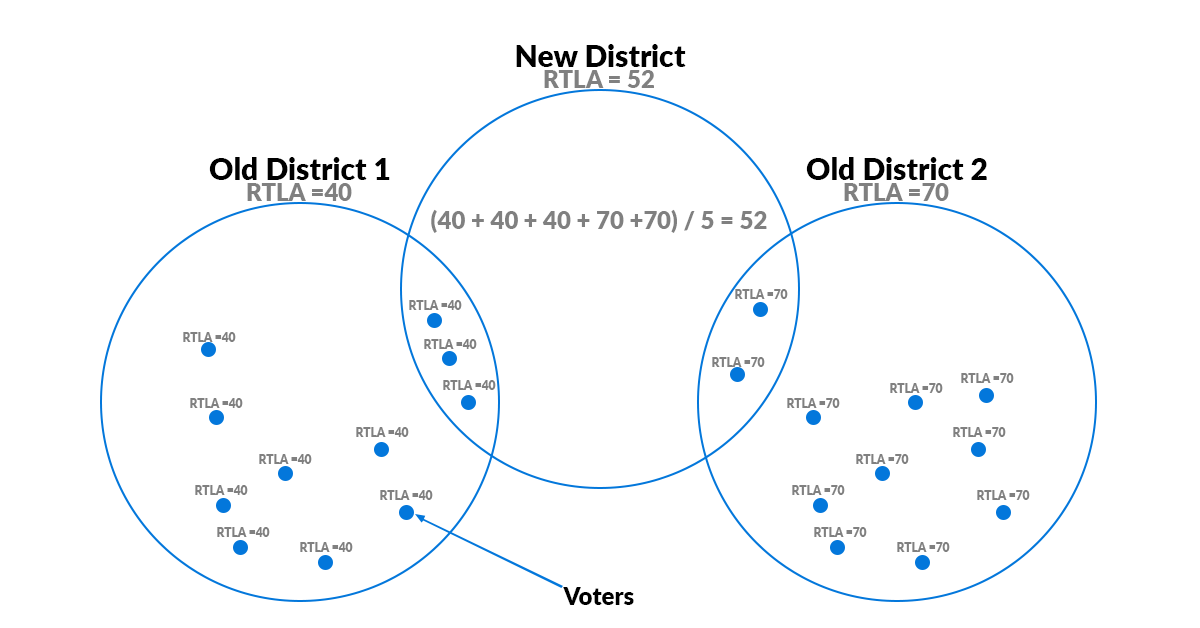
If the “New District” contains more voters from one district than the other (more likely) there’s no difference. We again average the RTLA figures for the voters within the new district together. In this case, there are three voters from “Old District 1” and two from “Old District 2.” Since “Old District 1” has a lower RTLA this pulls down the average for the “New District.” Now the RTLA for the “New District” is only 52.
It’s that easy.
It’s only executing this method on a four-million voter data set that makes it challenging. For those who are interested, you can review all of the code involved in the precise calculations at this GitHub repository.
[…] New Maps Paint Colorado Blue […]
[…] Colorado’s new map is significantly more blue. […]