 The SD20 Fallacy
Summary
CO Republicans consistently waste resources targeting noncompetitive legislative seats.
Traditional methods of measuring a race’s outlook don’t work in a fast-growing state like CO.
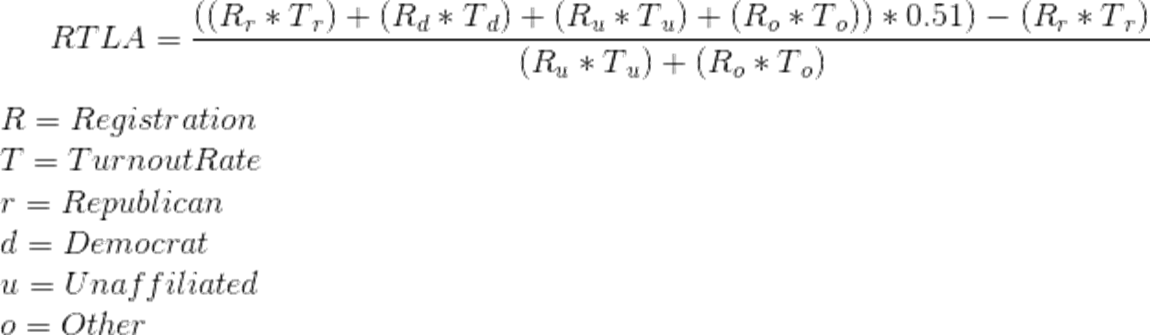
There is a more accurate index called RTLA that we should use to compare races.
Our inability to recognize these shortcomings is indicative of a broader problem: that our campaign methods haven’t advanced in decades.
Introduction
Every cycle legislative leadership spends well into the seven figures on our effort to capture or defend competitive legislative races. But our inability to understand which races are actually competitive has resulted in hundreds of thousands of dollars of waste each cycle and mounting losses over the decade.
The 2018 election cycle provides an excellent example of the cost of the conventional “wisdom” in targeting. In 2018, State Senate District 20 was treated as competitive. In a cycle where Republicans were going to be hard-pressed to hold the two seats necessary for our Senate majority, we wasted money trying to pick up three seats that weren’t even competitive.
Of the three Senate Districts targeted for pick-up in 2018, SD20 is the best example of the two failings in our usual approach to assessing district competitiveness.
The Conventional Wisdom
Typically a race’s competitiveness is assessed by examining historic election results for that district. Unfortunately, this method is not only deeply flawed but also the chief reason for my uncontrollable eye-rolling anytime someone refers to a race as an “R+something” district. To understand the depth of this flaw, consider this — comparing SD25 in 2020 to SD25 in 2016 is the mathematical equivalent to comparing SD25 in 2020 to SD24 in 2020. Using historical results is no different than trying to judge one district by examining a completely different one.
Just look at how confusing historic results get when applied to SD20.
In 2014 the Republican candidate for SD20, Larry Queen, lost by 0.6 pp at 46.2% v. 46.8%. According to conventional wisdom that’s the absolute best comparison for a 2018 contest – it’s a like year, the same district, and the immediately prior campaign. So everyone says “Hey we only lost by half a point that’s competitive!”
Ok, maybe we aren’t that reckless.
To make sure, let’s examine some other results for SD20. Maybe how President Trump did in 2016 – unfortunately, he lost the district by a painful 8.9 pp at 41.4% v. 49.9%. Ok, well that’s not really a valid comparison since there’s a big difference between a Presidential and a State Senate race. Maybe check how Heidi Ganahl did? Regent races are the classic go-to for generic ballot performance. She won by 2.4 pp at 51.2% v. 48.8%. Now we have three wildly different results – a narrow loss, a crushing defeat, and a comfortable win:
2014 – Larry Queen – 46.2% v. 46.8% – -0.6
2016 – Donald Trump – 41.4% v. 49.9% – -8.9
2016 – Heidi Ganahl – 51.2% v. 48.8% – +2.4
All of these results from the same district across only two cycles. But only Larry Queen’s is actually a race at the level we’re interested in. The other two represent one of the best over-performances and one of the worst under-performances for statewide Republicans this century.
How can we reconcile such wildly different results?
In an attempt to bring some order to this chaos, results for a district are typically averaged over the course of several cycles and/or races. This is where the race classifications of “R+/-X” or “D+/-X” that you’re probably familiar with come from. This is simply the average of the point difference in election results between the two parties. We use this measure because averages are about the most advanced math that politicos are capable of. (I kid, in truth the media actually likely bears the blame for this… along with so much else)
Unfortunately, the “average” method has yet another glaring error.
District Drift
The problem of reconciling varying district results is just the beginning. There’s an even greater challenge — registration drift.
Between 2014 and 2018, SD20 lost 1,864 Republicans but gained 3,087 Democrats and 8,534 Unaffiliated voters. That’s a 20% explosion in Unaffiliated registration! How do we weight those changes into our conflicting election results? (I’m actually asking, by the way; if someone can write out the formula to convert the 2014 results into what they would be under the new registration mix I’ll drop this whole thing.)
But wait, there’s more. Let’s not forget we’re typically performing this analysis 18 months in advance of the election so the current registration doesn’t even matter. We need to adjust our original results based on where registration will be at the time of the election, not where it is now. How do you forecast future registration and apply it to your already wildly conflicting results?
See how needlessly complicated this gets? And our catch-all solution of averaging won’t help either because that is also a backward-looking calculation.
Beneath the apparent simplicity of the usual approach to assessing a district’s competitiveness lies layers of complexity that are only concealed by ignorance, laziness, or both.
Indexing with RTLA
Luckily there’s an easy solution to the shortcomings of the usual method — ignore all that B.S. and use a single metric that controls for district differences across time and geography.
To those who’ve bothered to ask over the years, I describe RTLA as the percentage of Unaffiliated & Other voters a candidate needs to capture to get 51% of the vote. But, that’s not entirely accurate. RTLA is really an index that allows one to make like-for-like comparisons between districts and times regardless of registration differences. Simply put, it’s one number that describes how challenging a district is for Republicans; the lower that number the easier the district is to win.
Instead of doing all that crap I said up above, all one need do is look at one number. In 2014 when we lost SD20 RTLA was 46.7. That marked an all-time low for the index and was obviously a killer year for Republicans. In 2018 RTLA was 56.6. The district became ten points more challenging! And we knew 2018 wouldn’t be as strong a year for Republicans. Is it really realistic to think we could do 10 points better among Unaffiliated voters in a climate like that? Of course, it was out of reach!
Performance Comparison
Let’s look at how these two methods perform in practice. We’ll use Colorado’s 2020 State House landscape since our only opportunities for pick-ups in 2020 are in the House. Additionally, our 2020 pick-up opportunities are very intuitive — the four seats we lost in 2018.
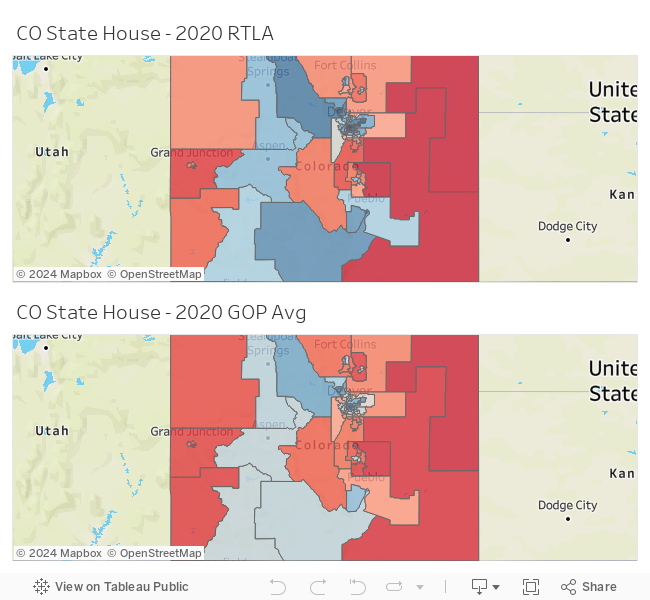
The two maps above show how competitive each Colorado State House district is in 2020 using the two methods we’ve discussed — RTLA and historic performance. The more red a district is the easier it is for a Republican to win.
The results of the two measures are similar but there are some critical differences. For example, the difference in HD25. Under the typical result of averaging past Republican performance this seat shows as safe Republican. An odd result considering the seat is now held by a Democrat. The historical average measure gets this wrong because HD25 was a safe Republican seat until 2018 when it finally flipped. The RTLA measure more accurately reflects this seats prospects, showing it right in the heart of competitive territory.
Once again, the method of using historic results doesn’t respond fast enough to changes in registration.
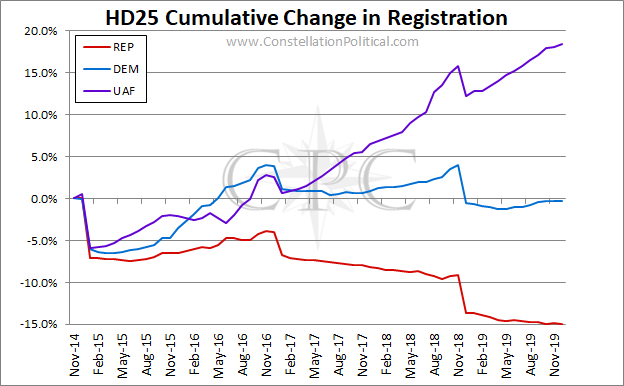
Since the 2014 election, Democrat registration in HD25 has held steady while Republican registration has declined by 15.0% and Unaffiliated registration has grown 18.4%. Once again, using historical results as recently as 2018 would yield a flawed result because a full third of the decline in Republican registration has happened since the last election.
If you scrutinize the two maps above, you’ll see a similar dynamic is at play in each of the State House seats that we lost in 2018 and hope to retake in 2020.
Innovation Stagnation
So, we waste a few hundred thousand dollars taking a flyer on some long-shot races. Is that really so bad? As an organization, we Republicans waste more money on much worse ideas. In comparison, this isn’t all that terrible. But, it’s a clear-cut example of two real problems we’re facing.
In the 21st Century, with the rise of machine learning, digital campaigning, analytics, targeting, and the lip-service that we pay to all these things — we have not made a single tangible change in the way we run campaigns. Even the basic first step of deciding what is competitive is done the same way it was decades ago. This averaging of race results galls me so because the flaws in this old method of targeting should be apparent to anyone who has sat down and actually attempted to calculate those numbers themselves. We have ceded our strategic decision-making to people who aren’t only unqualified to perform the analysis in the first place but lack the skills to critically interpret any analysis that’s done for them.
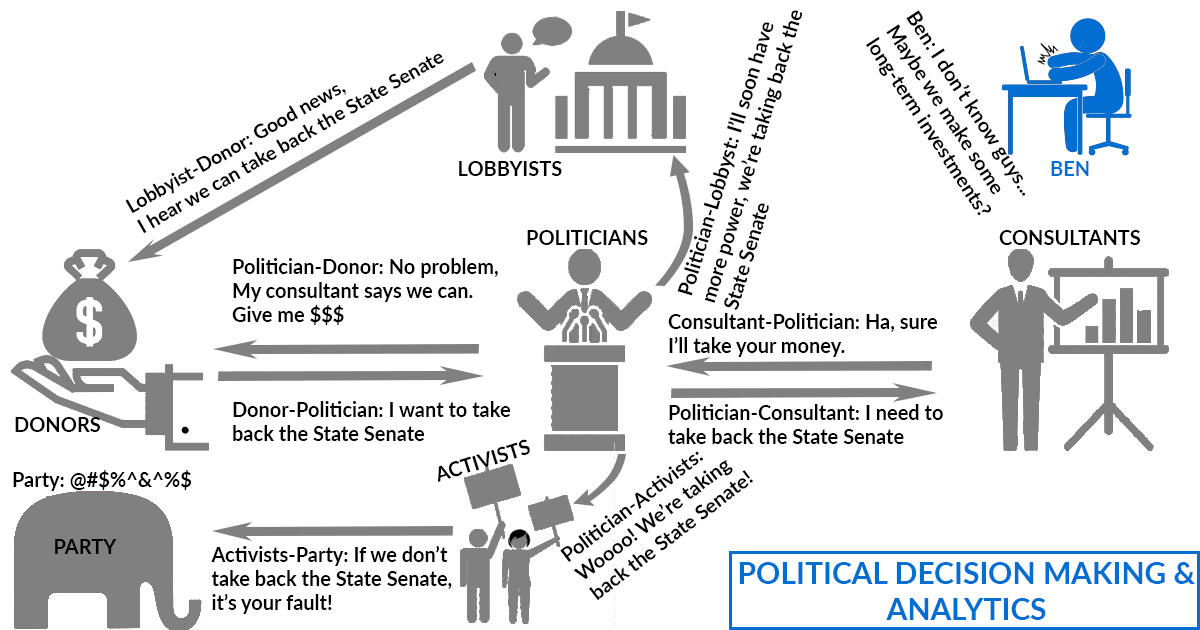
Destructive Reinforcement & Infinite Loops
The assertion that we should, in the age of technology, embrace technology isn’t exactly a revelation. But, the second major problem we face is much more subtle — we’re all living in an echo chamber. In Colorado especially, the Republican Party is a rather small, tight-knit, group. We all talk and as things get passed around with greater frequency they take on the sheen of truth. …no matter how baseless they are. As Ayn Rand once observed, “People said it because other people said it.”
The echo chamber effect is combined with a perverse incentive system. Every cycle we are incentivized to make moon-shots instead of strategic, long-term investments; investments of the kind that allowed Jared Polis to turn Colorado blue and propel himself to the Governor’s Mansion. Politicians are rewarded for moon-shots, moon-shots fire up the base, and donors pay for results. The outcome is an ecosystem where no one cares about reality because the myth has been so oft repeated that it’s usurped reality.
Of course, we all like to think we’re quite clever individuals. And I’d reckon that’s true… as individuals. If you’ve bothered to read this far you’ve probably got a pretty good grasp on politics. This echo chamber effect is so dangerous precisely because it is so subtle. Without realizing it, our opinions get eroded by the conventional wisdom, we get infected by the enthusiasm of our tribe. Unless you’re constantly holding a mirror up to yourself and thinking about this effect you’re likely to get caught up in it.
So what is this mirror that we can hold up to ourselves and our efforts? How do we keep ourselves grounded?
Easy, by relying on quantitative data. Facts, not opinions, not beliefs, not myths, not fallacies.