 How Republicans Will Lose 2020 Reapportionment
It’s no secret that Republicans have had a tough run in Colorado since 2014. Since the last round of reapportionment in 2010 we’ve never managed a State House majority and only pulled a Senate majority during two cycles.
However, there’s new hope for Republicans as we’re now engaged in the drawing of new maps for the next decade.
The current round of reapportionment brings with it new rules governing the process. Reapportionment is now to be overseen by a new, even more, bipartisan commission. But, most importantly, this commission has a mandate to draw competitive districts.
But, what is a “competitive district”?
Shockingly, the new process even outlines a definition for “competitive.” The new rule is that a district must have a reasonable chance of changing party representation at least once within the 10-year lifespan of the district configuration.
Of course, that doesn’t make this whole process any less laughable. After all, who decides how to calculate competitiveness?
I’ve given a lot of space on this blog to the right, and the ridiculous, ways in which we calculate the competitiveness of a district. The prevailing methodology, and the one likely to be used by the commission, is to simply average partisan election performance over the past couple of elections. This approach is completely absurd, especially in a state with rapid population growth. Sound familiar?
If Republicans, and all Coloradans for that matter, want to ensure truly competitive districts for the next decade we need to consider the next decade. Not just the next election, and certainly not elections that happened two, four, or six years ago. We need to acknowledge the fact that districts change over time, and draw maps that reflect that fact.
Elections happen at two-year intervals and a lot can change in the course of two years. We Republicans suffer from an odd lack of awareness around this fact. And you know what? Democrats are banking on that to continue. When considering potential legislative maps we need to be thinking about more than just 2022.
To illustrate my point, let’s wind the clock back ten years and recall our excitement for some of our current districts as they faced their first cycle in 2012.
Historic District Drift
Consider some of the races that we Republicans have recently handed to Democrats. In 2012 HD-25 was still a safe Republican district, now we’ve lost that district twice in a row. How did this happen? It’s because Democrats know something Republicans don’t – that things change with time. Look at the difficulty of HD-25 over the duration of its current configuration.
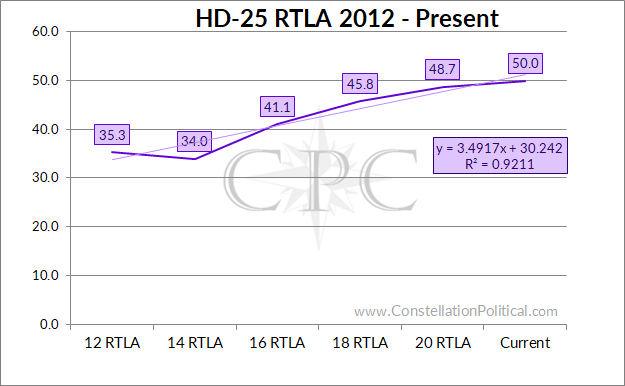
Graph 1 shows the percentage of Unaffiliated voters that would have to vote for the Republican candidate for the Republican to receive 51% of the total vote in each cycle. Not surprisingly, Republicans have needed greater numbers of Unaffiliated voters to continue to carry HD-25. In 2012 a Republican could win HD-25 with as little as 35% of the Unaffiliated vote, by 2020 that figure had grown to 49%.
That Colorado is trending to the left is not surprising. But what is surprising is how consistent district trends are – the deterioration in HD-25 has followed an almost perfect linear trend. As you can see in Graph 1, the R2 of a linear regression against a Republican’s required Unaffiliated performance is 0.92. This means that 92% of the variation in the required Unaffiliated performance can be explained by the simple passage of time. In other words, HD-25 has consistently become 3.5 points more difficult for a Republican every cycle.
What are we to take from this?
First and foremost, we can’t consider the new maps as they are drawn now. We need to adopt a view that encompasses the entire lifetime of the districts now being drawn. If 2020 is anything like 2010, Democrats will bait Republicans, and the public, with maps that appear competitive now but will quickly turn in their favor. And the commission and courts are sure to back them. Why wouldn’t they? The concept of district performance drift is a challenging thing to explain to experienced political operatives let alone the public.
The other takeaway from this is that districts evolve at a predictable rate. (Certainly as predictable as meaningless averages.) This means if we’re serious about getting competitive districts, there’s a mathematical formula that we can follow. In some parts of the State, simply averaging the past few cycles of candidate performance will give Democrats an advantage. But that’s the route we’re poised to take, and to take by conscious decision, nonetheless.
If we’re serious about fulfilling the new legal requirement that districts be competitive, we need to base maps on where districts will be in the future, not where they have been in the past.
We need to base maps on where districts will be in the future, not where they have been in the past.
As shown in the HD-25 case, we can easily quantify the leftward drift in districts. We can also quantify the point at which districts transition from Safe Republican, to Swing, to Safe Democrat. All these figures will vary based upon their region of the state.
In some areas of the state, such as the Denver suburbs, drawing truly competitive districts means drawing districts that favor Republicans now with the understanding that they’ll steadily drift Democrat over the next decade of their existence. With a legal definition of competitive that says “competitive” is a district that could change party control once in a decade, we should be drawing districts now that will be reaching peak competitiveness for Republicans as we cross 2025, then they’ll begin to favor Democrats.
Consider a few other examples.
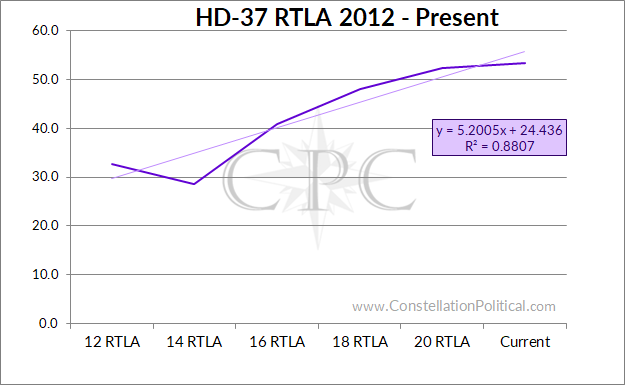
HD-37 was also reliably Republican for most of its existence. However, it has become five points more difficult for Republicans every cycle under the current map until we lost it in 2018. Again, this trend has been extremely consistent with a linear R2 of 88%.
Lest one should interpret this as me saying we need a Republican-leaning legislative map, let me point out what should be obvious – this dynamic cuts both ways.
Of course, districts in the greater metro area have a steady left-ward drift. But, as one would expect, the opposite dynamic is at play in the rural portions of our state. Consider HD-46.
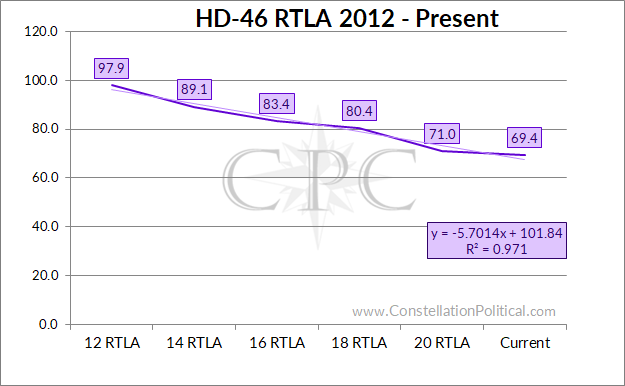
As Graph 3 shows, HD-46 has grown six points more favorable for Republicans for every cycle that it has existed. Again with an extremely consistent linear trend, showing an R2 of 97%. Thus, drawing a truly competitive district in the plains would require drawing a district that favors Democrats by about 12 points at the outset.
Now, this gets into the other critical element of district competitiveness. We, and the reapportionment commission, like to think that registration is the end-all-be-all of competitiveness. But drawing districts that are one-third Republican, one-third Democrat, and one-third Unaffiliated doesn’t create competitive outcomes. Elections are determined by those who turnout out to vote, not those who are registered. Anyone who has been around politics should understand this.
Drawing districts that are one-third Republican, one-third Democrat, and one-third Unaffiliated doesn’t create competitive outcomes.
Equally as apparent to those who’ve spent any time in Colorado politics is the fact that Unaffiliated voters break in predictable and consistent ways. If we consider a candidate’s required Unaffiliated performance as the measure of a district’s competitiveness (which we should) we also need to consider at which thresholds districts become competitive. In the metro area, Republicans have a hard time capturing more than 45% of the Unaffiliated vote. But in other portions of the state, this figure can climb much higher. Luckily we also have historic data to provide guides for this.
Consider the HD-25 example in Graph 1 again. The district went Democrat once a Republican would have needed 46% of the Unaffiliated vote to prevail, but Republicans were victorious in 2015 when the required Unaffiliated performance was 41%. If we don’t overthink it, we can assume the threshold of competitiveness for this region of the State is a required Unaffiliated performance of 44%. And, since we know that this region is trending away from Republicans at a rate of 3.5 points per cycle, we can say that a competitive district drawn in this region should start with a required Unaffiliated performance for a Republican of at most 37%. This would give Republicans an edge in the early stages of this new map, then toward the end, as it follows its natural deterioration, it would begin to favor Democrats.
The concept that Colorado is growing, and with it, both voter registration and Democrat performance shouldn’t be that revolutionary. And yet we, and the reapportionment commission behave as though this concept is so alien, so impossible to understand or describe, that it doesn’t even bear mentioning.
Why don’t we acknowledge the obvious and insist on maps that take this reality into account? While I’m sure part of it is some sort of Democrat conspiracy (my friends on the left constantly tease me about our lack of sophistication in this area). The real reason we can’t do this is because both our party and the reapportionment commission lack the sophistication to not only understand this issue but to then quantify it and draw fair maps.
And that’s why you’ve found this in your inbox. So that you can now understand this problem and help raise this issue. Who knows, perhaps if we’re vocal enough we can inspire the reapportionment commission to acknowledge the fact that our State is and will continue to change over time. And, if we’re really lucky, maybe we can even get them to revisit their High School algebra classes and take this seriously.
Howdy KT, Appreciate the thoughtful comment. Truth be told there’s a lot of criteria that supersede the new “competitiveness” requirement so my focus is just on the strict definition of that requirement provided by the new law. Adopting my proposed approach would likely lead to equal outcomes over the 10 years of a district’s life but that isn’t necessarily my intent. My intent is to adhere to the letter of the law which says that to be competitive a district must be able to change hands at least once in the decade. Theoretically, it should be possible for a few… Read more »
Hi Ben – Appreciate the analysis. Is your overall take here that a ‘fair’ map would produce equal outcomes over those 10 years (i.e. 50/50 numbers average of R’s and D’s elected in the decade period) or merely that the focus should be creating a map that will produce wins for R’s in the early elections in the decade given the trend to districts becoming more D over that same time (your prediction given historical trends)? If I’ve missed the point – I’d love your take on what a fair map looks like, and what the process should look like… Read more »