 Colorado’s 2018 Election Spending
Summary
Democrat’s whole spending advantage came from Jared Polis himself.
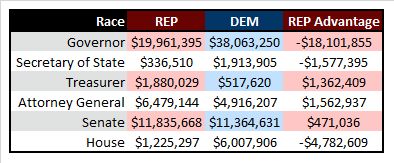
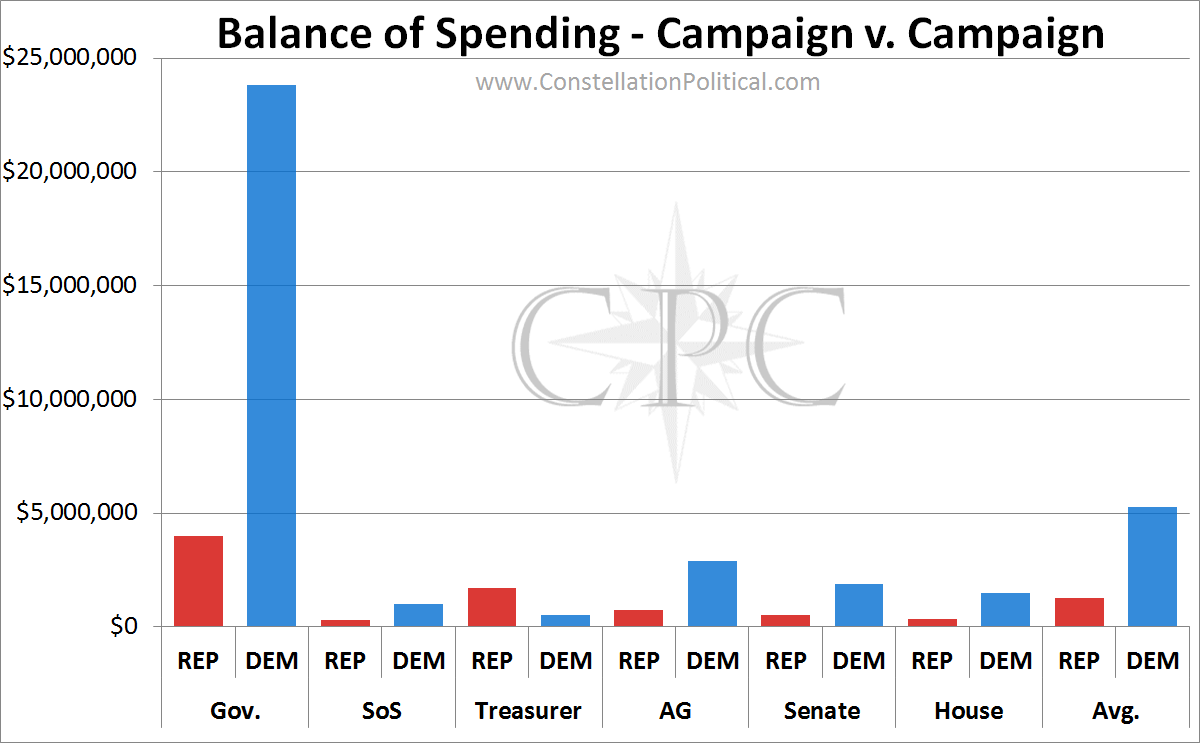
GOP organizations outspent Democrats in the Treasurer, AG and State Senate races.
Democrats tended to ramp up spending earlier than Republicans.
Both sides spent most of their money on TV.
Republicans tended to favor direct mail behind TV.
Democrats tended to favor staff, organization and digital behind TV.
Republican campaigns were consistently outraised by Democrat campaigns.
Democrat’s also spent an odd $1 mln on unspecified “research” for their legislative races.
Colorado’s 2018 election spending surged to an unprecedented level thanks to Jared Polis’ massive infusion of personal cash. This lopsided election spending was a significant factor in the crushing defeats experienced by Republicans. But, it wasn’t just about the amount of money spent. There were also differences between the two parties in the type and timing of their spend.
Gubernatorial Election Spending
The governor’s race was the most prominent statewide race in 2018. But, despite the huge amount of money spent, this was not the most lopsided contest of the year.
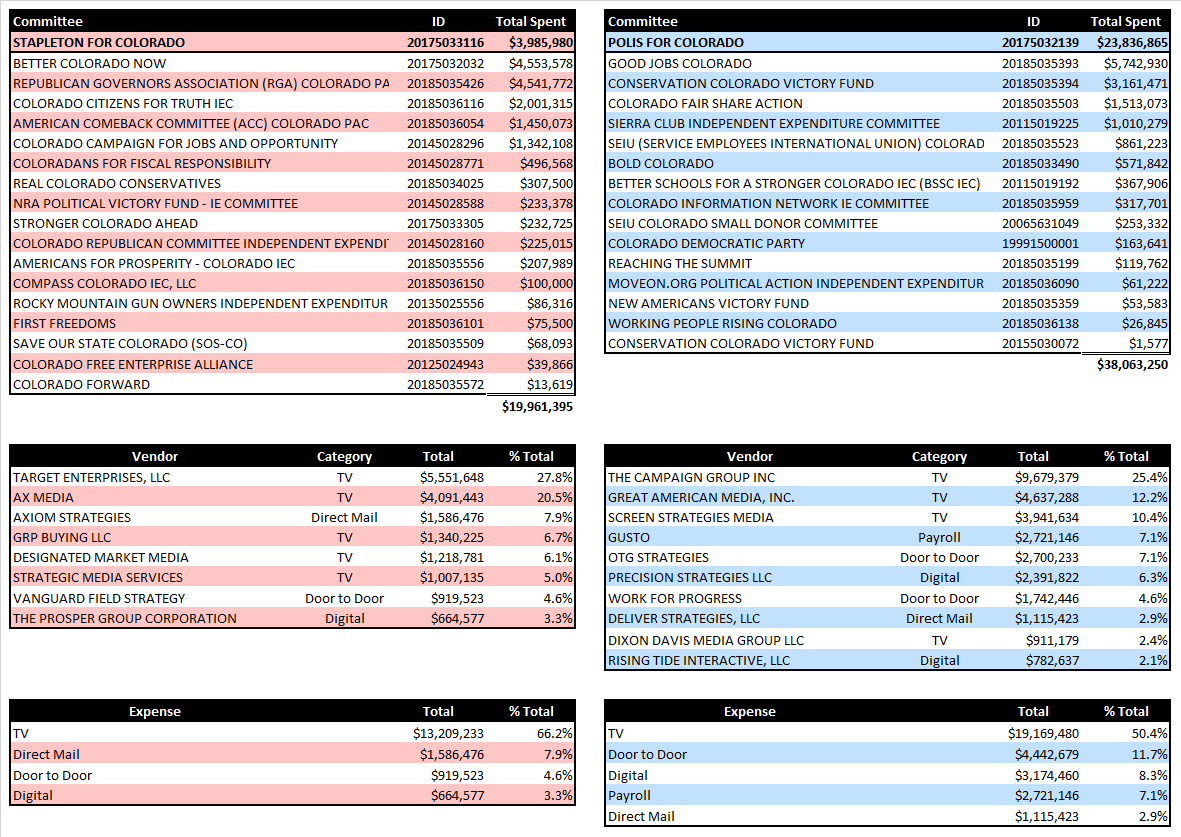
The tables above show the various committees that were involved on both sides of the race, the vendors that received most of the money from those committees and what that money was spent on.
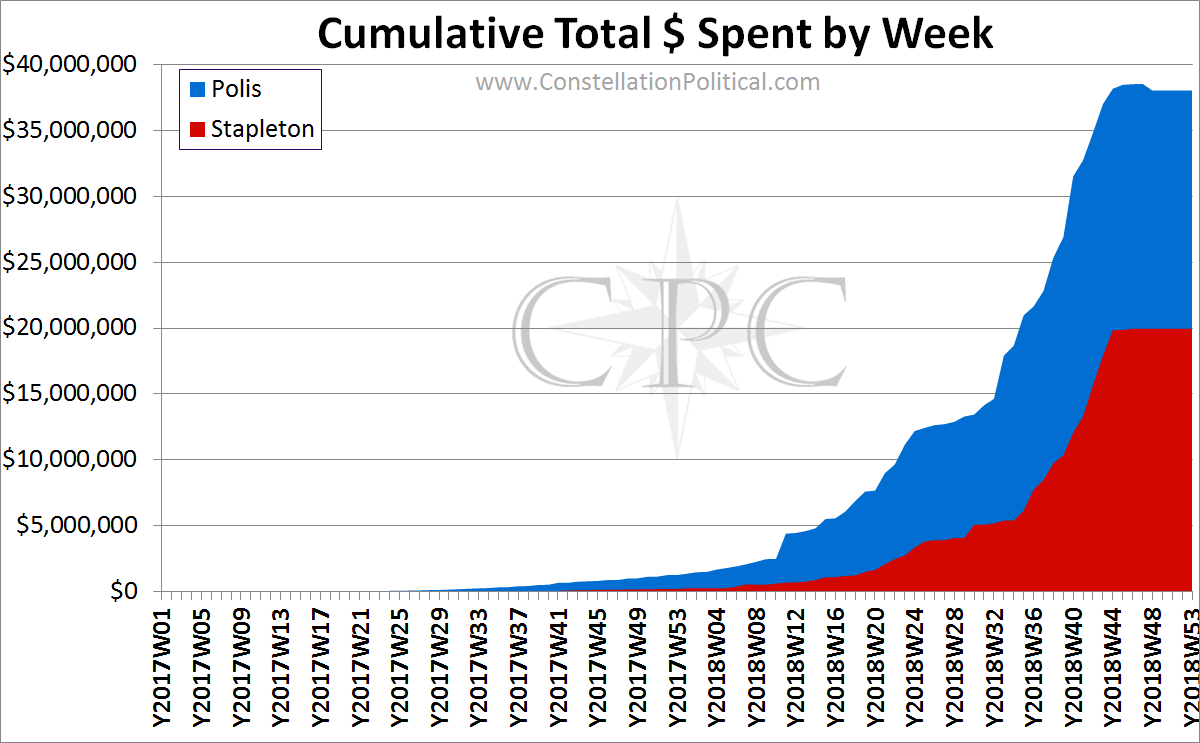
The headline here is the total. Republicans were outspent by two-to-one. On the Republican side, the Stapleton campaign represented the vast minority of money spent. The campaign only spent $4 mln of the $20 mln total spent by Republican groups. This dynamic was reversed on the Democrat side. The Polis campaign spent $24 mln of the $38 mln total spent by Democrat groups.
Despite the size of the budgets on either side of the aisle most of the money went to a small group of vendors and consultants. On the Republican side 80% of the money spent went to just eight companies. On the Democrat side, 80% of the spend went to ten companies.
Both sides spent the largest portion of their budget on television and mass market advertising. The next largest expense for Republicans was direct mail, whereas for Democrats direct mail was the smallest of their major expenses. Democrats favored organizational expenses like staff and grassroots contact followed by digital advertising.
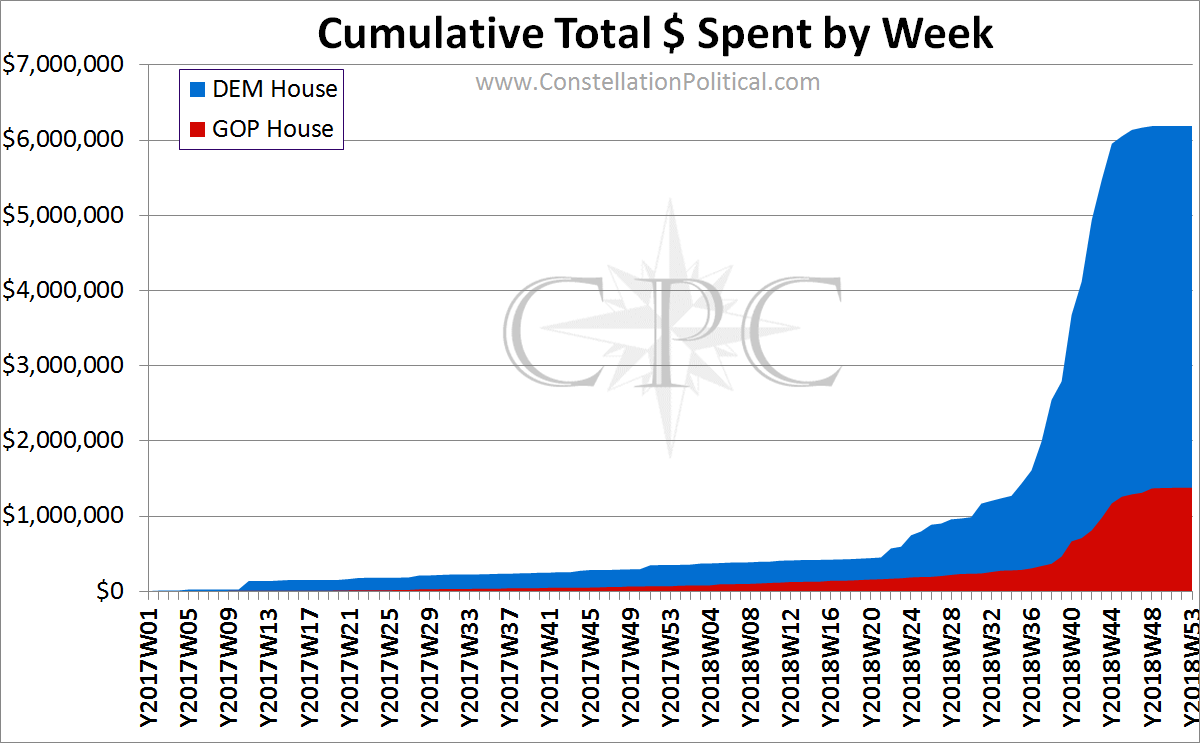
Campaigns can’t always control how much money they’ll have available. However, they can always control when they spend it.
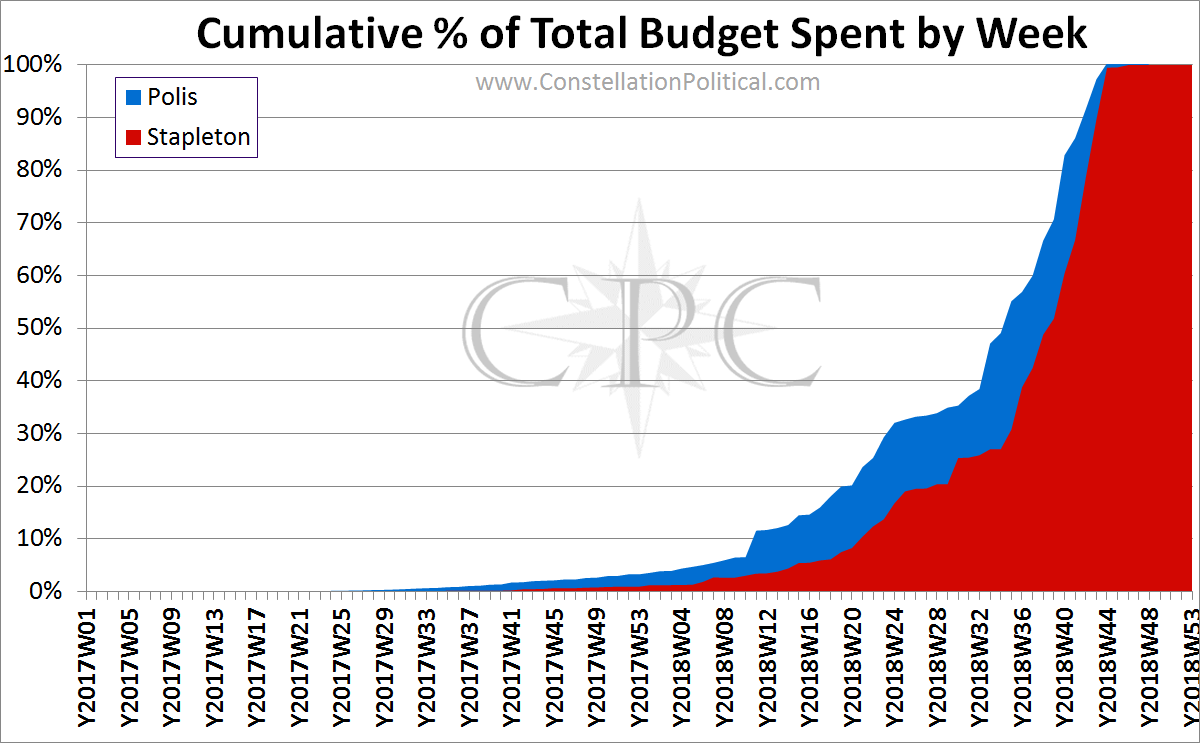
Graph 1 shows the cumulative percentage of each organizations budget that was spent by each week of the two year cycle. As you can see, Polis aligned organizations spent their money earlier than their Republican counterparts.
In real dollar terms, Democrat spending on the gubernatorial race completely eclipsed Republicans.
Secretary of State Election Spending
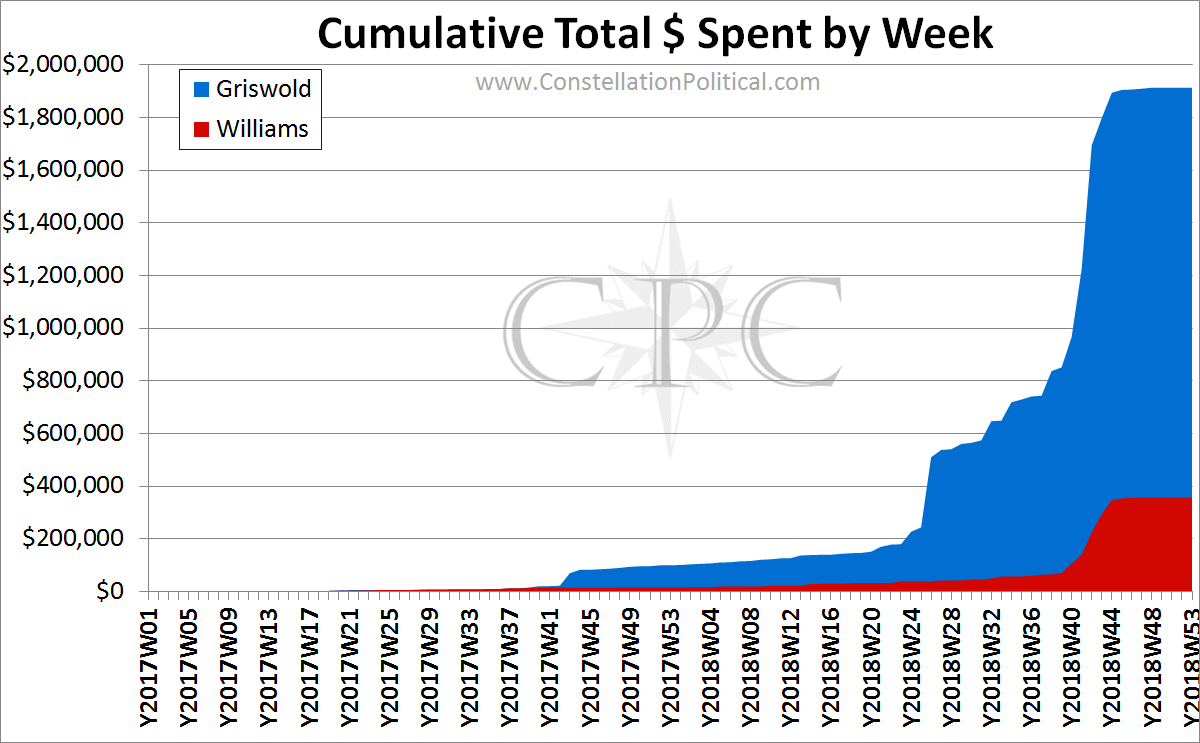
In the Secretary of State race, Jena Griswold managed to spend three times what Wayne Williams did, a massive sum for a race of this kind.
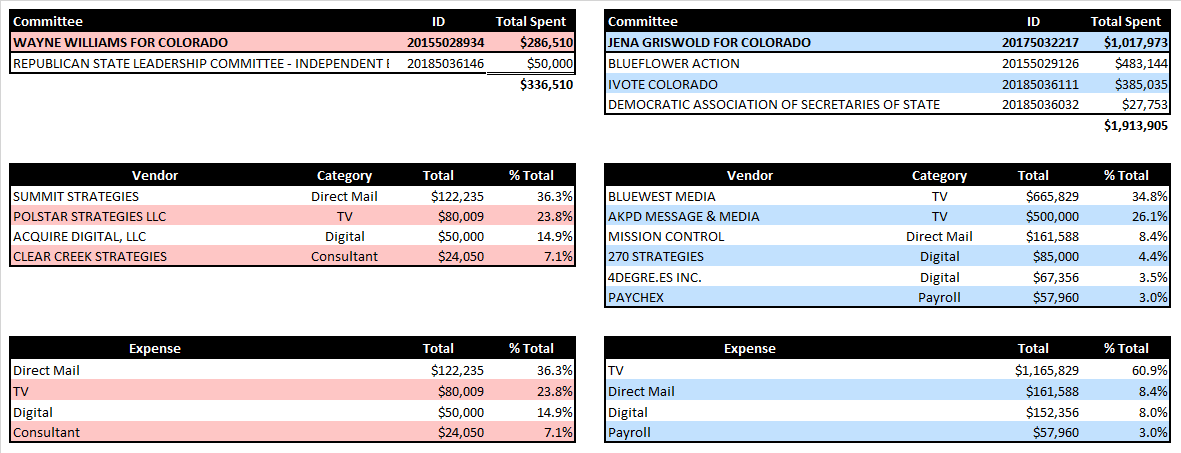
The vast majority of Griswold’s spending went toward television. Her campaign was able to afford a seven figure TV spend whereas the Williams campaign was only able to spend about $80k.
Treasurer Election Spending
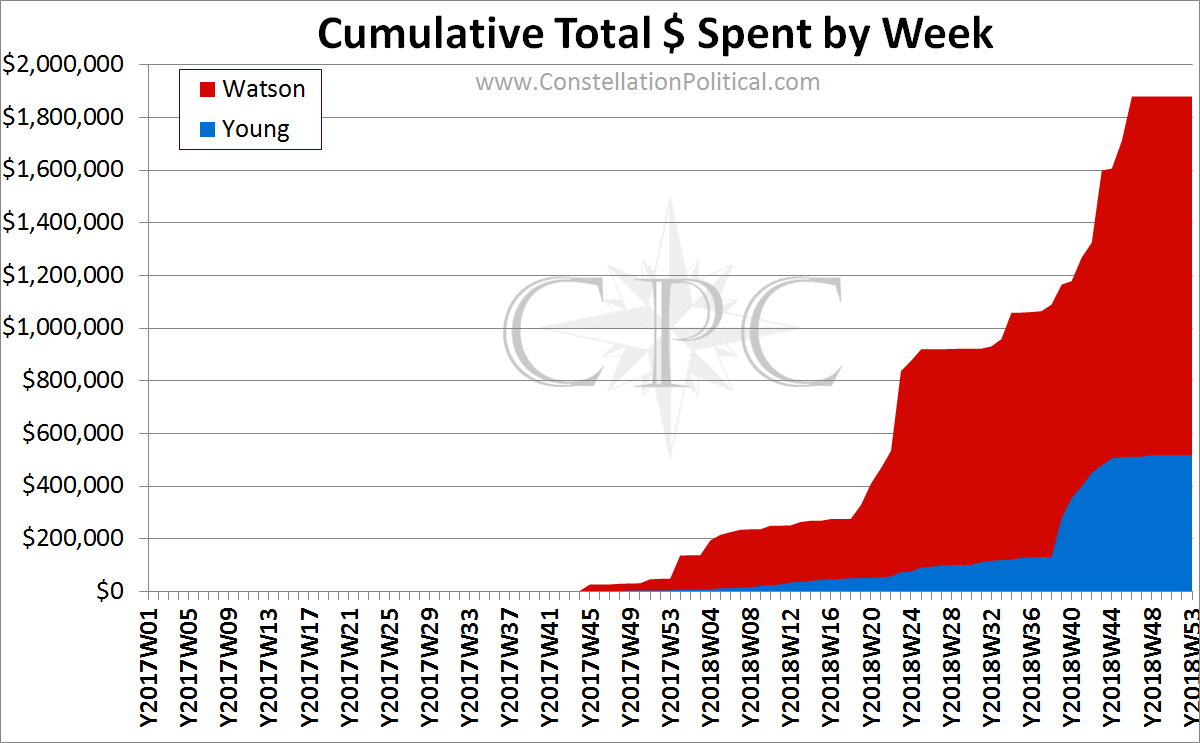
The Treasurer’s race had the opposite spending dynamic of the Secretary of State race. Brian Watson was able to spend about three times what Dave Young was. Additionally, this was the only race where a Republican campaign spent more than its Democrat opponent. Of course, this was owing to Watson’s ability to put his own money into the race.
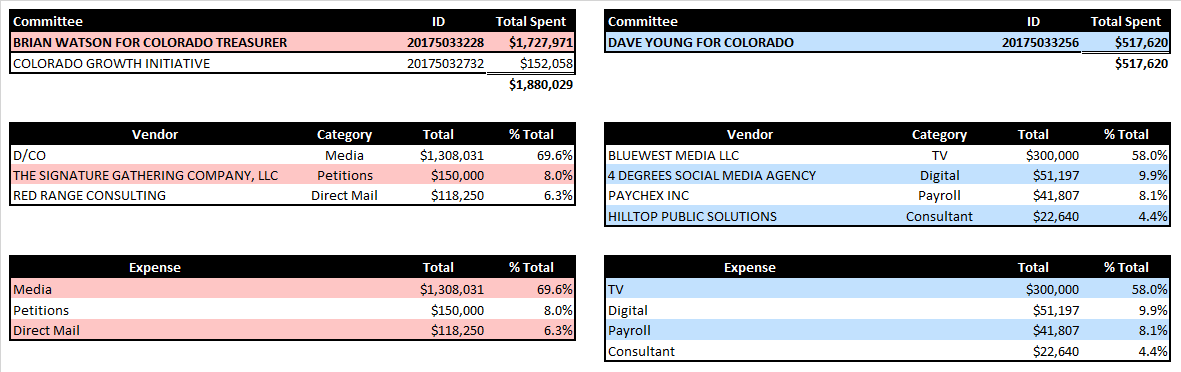
Dave Young used the same media firm for his television as did Jena Griswold and this represented his largest expense.
Attorney General Election Spending
The AG race also commanded an unprecedented amount of spending. And here too Republicans outspent the Democrats. Groups supporting George Brauchler managed to spend $1.5 mln more than their opponents.
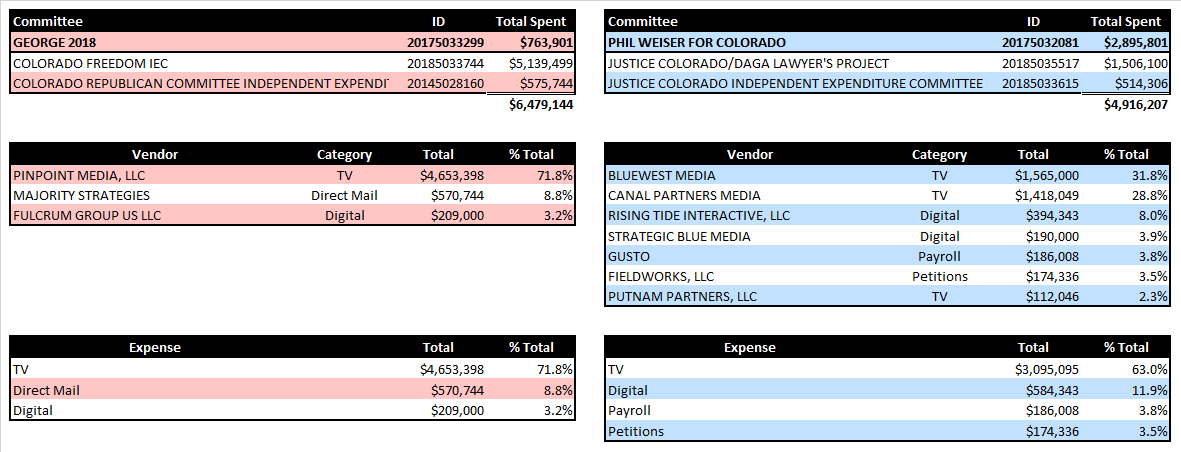
Both sides spent the bulk of their money on TV but Democrats favored digital over direct mail. Weiser again used the same media firm as did the other down-ticket statewide Democrats.
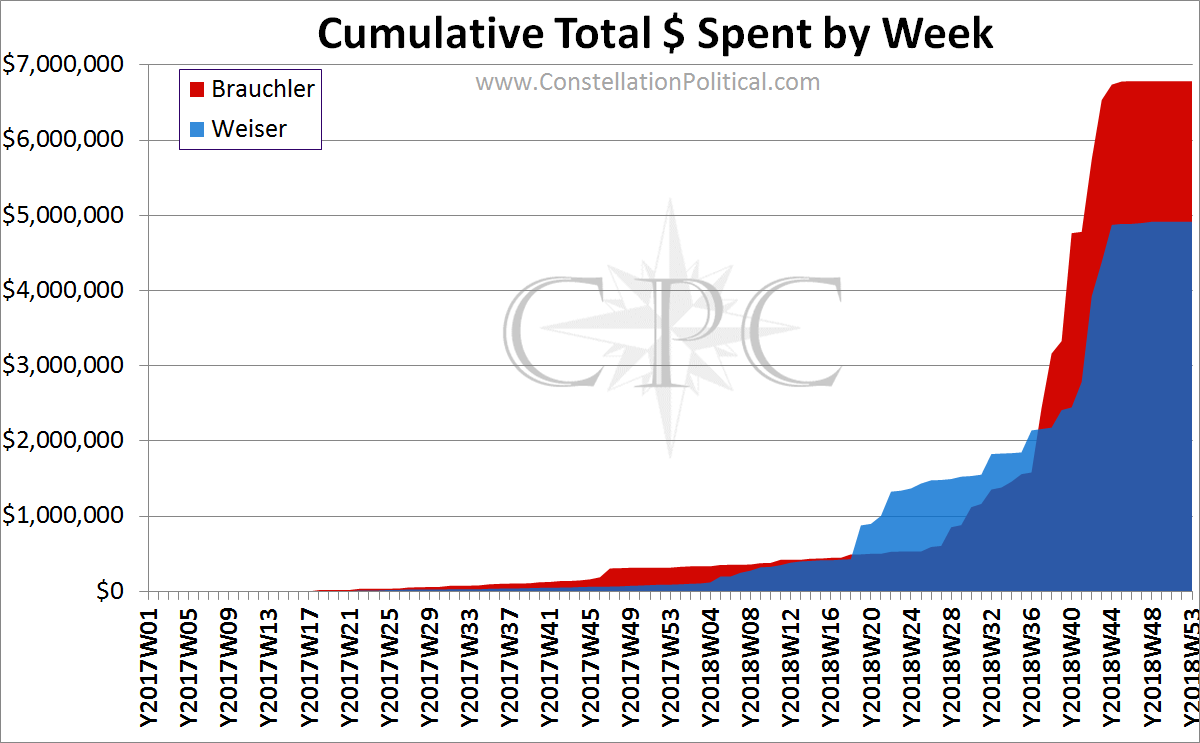
Despite spending more total dollars than Weiser aligned organizations, the Brauchler committees ramped up their spending later in the cycle.
State Senate Election Spending
The most competitive legislative seats in 2018 were SD16 and SD24. The interest in the State Senate led to balanced spending by each side. Both sides spent about $11 mln spread over five districts. The Democrat spending was much more concentrated across committees, though more diverse across vendors.
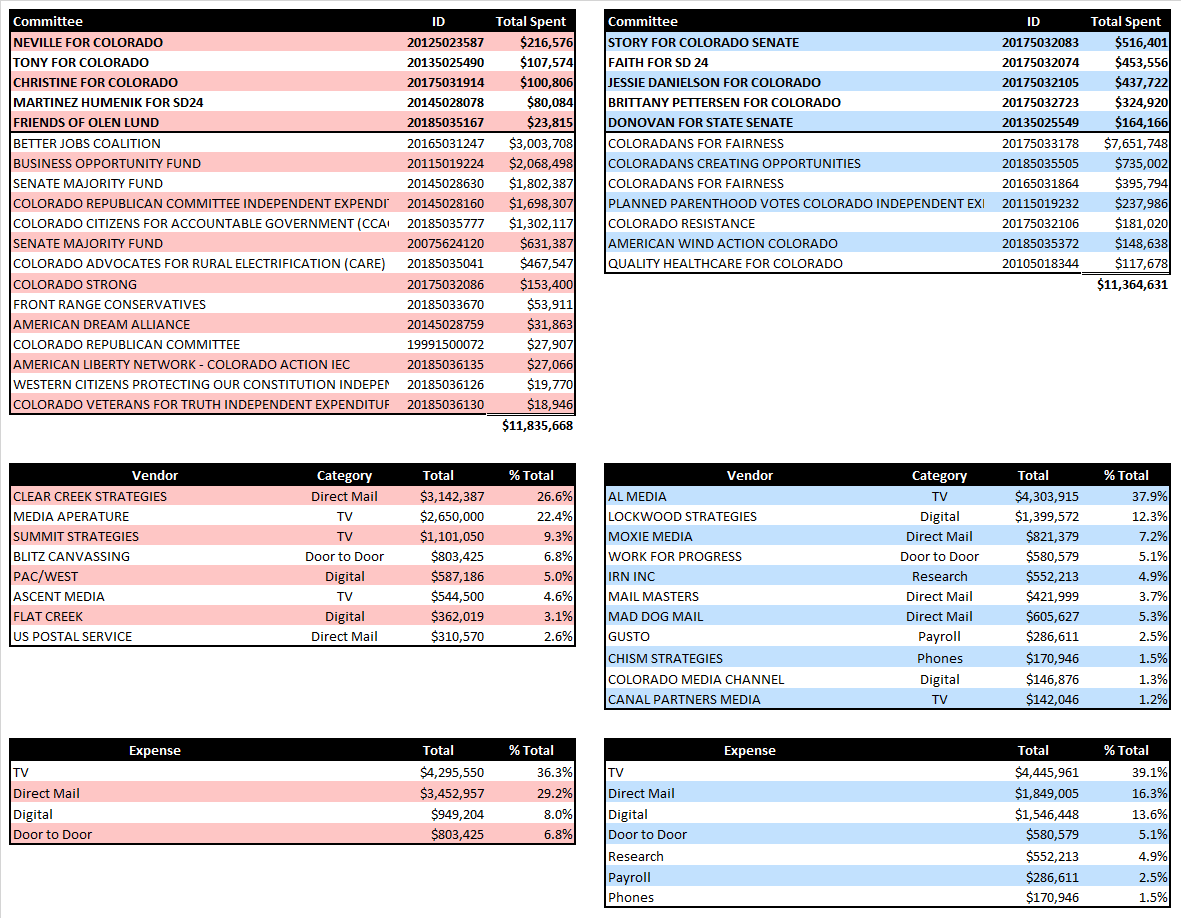
Despite the near parity in total spending between the two sides, the Democrat campaigns completely dominated their Republican counterparts in spending.
Here too, TV spending was the largest expense on both sides. Spending on direct mail was the next largest portion of the Republican budget. Republicans dedicated twice as much of their budget to mail as did Democrats. Note that “research” made it into the top of the list of Democrat expenses.
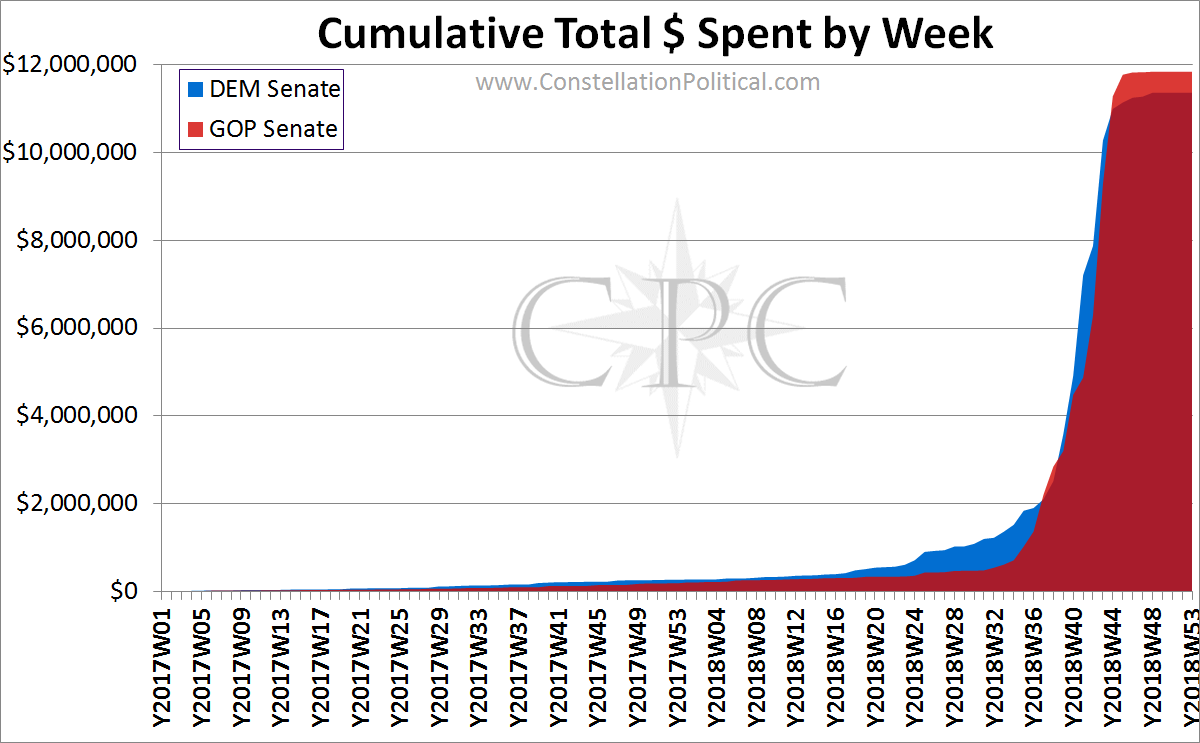
Despite the fact that Republicans managed to spend slightly more than Democrats on State Senate races, Democrats again ramped up their spending earlier.
State House Election Spending
The situation in the State House was messier than the other races owing to a lack of consensus about which races were competitive. Technically, there should have been no opportunities for any State House races to change hands. However, Republicans went on to lose four seats, three of them safe for Republicans and two of these seats were not even targeted by Democrats.
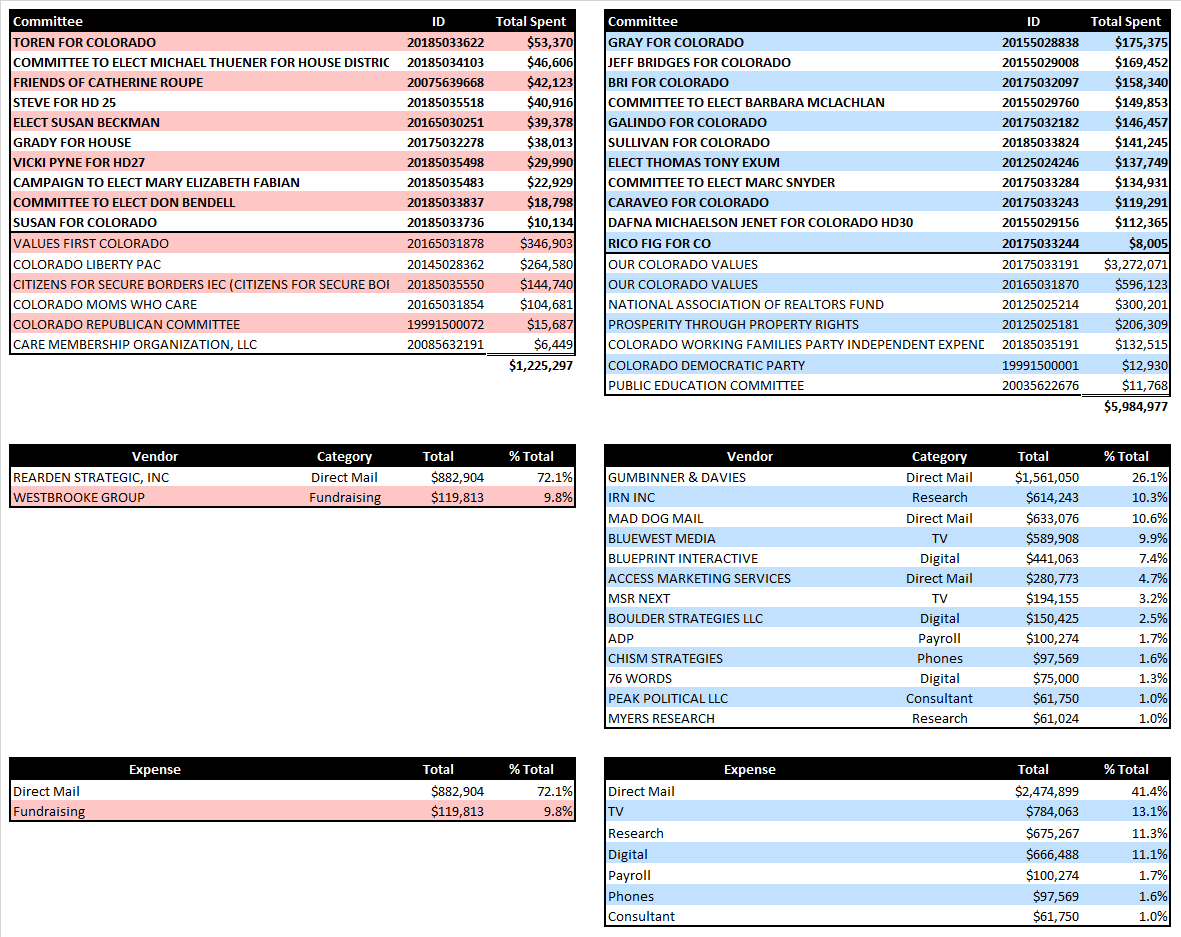
Democrats managed to raise a whopping $6 mln for their State House effort compared to only $1.2 mln for Republicans. It was also the case once again that the Democrat campaigns themselves dramatically outstripped their Republican counterparts.
Direct mail was the largest portion of the budget for both Republicans and Democrats. This is mostly due to the diversity of organizations involved in the House contest. On the Democrat side the second largest expense was “research.”
Conclusions
The prevailing viewpoint is that the chief cause for Republican losses was Democrat spending. But, the entirety of the Democrat cash advantage came from Jared Polis himself. Republicans were outspent in three contests and we outspent Democrats in three. The chief contributors to the Republican cash disadvantage were the Gubernatorial and State House races.
The other oft repeated takeaway from the 2018 cycle is that Republicans were too dependant on direct mail.
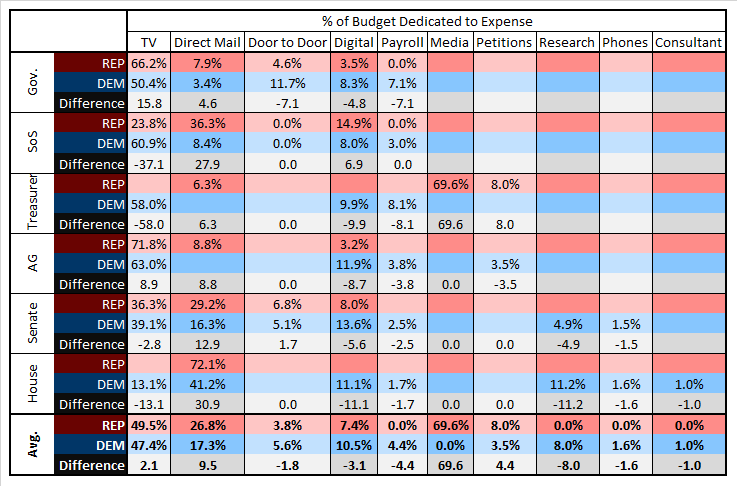
On average, Republican organizations spent 9.5 points more of their budgets on direct mail than did Democrats. However, considering that Republican leaning voters tend to be older I’m not sure this fact alone is enough to say that we spent too much on direct mail.
Of the remaining expense categories digital was the most relevant where Republicans underspent.
The timing of each side’s spending was the other consistent difference. Devotees will recall I first pointed out the emerging trend of Democrats pulling their spend forward back in 2014. During that cycle the Hickenlooper campaign ramped up spending around the Primary in order to mitigate Beauprez’s Primary advertising. This year, however, Democrats in every race save the Treasurer’s ramped up their campaigns before Republicans.
It also appears that Republican campaigns are fading towards irrelevance. Many of our campaigns failed to raise enough money to be minimally viable. And in almost every instance our candidate’s were handily outmatched by their Democrat opponents. The only thing keeping Republicans in the fight is our independent expenditure committees.
The final point of interest is the Democrat’s “research” spending. Between the Senate and House they spent over $1 mln on research. There is no way they spent this much on opposition research. Further, it all went to a firm that appears to be controlled by Al Yates. Something to think about.
A Few Notes on Methodology
Longtime readers may recall that this post-mortem used to include a lengthy section about contributions as well. An examination of contributions wouldn’t have revealed much because our campaigns were so thoroughly dominated by their Democratic opponents. On top of that, most of the entire cycle spending came from one man. So the impact of individual donations was quite a bit reduced from prior cycles. For those who are really curious about donations here is the headline: Democrats get a lot of small donations, Republicans get a few large donations.
The cycle-long expenditure data is quite complex. At the state level in 2018 there were over 100,000 unique expenditures. As fun as it sounds, I wasn’t about to go through and classify all of those. To cut through the noise I classified expenses at the organizational and vendor levels. Committees were classified based on which race they spent the bulk of their money on. Additionally, vendor expenses were classified using the same rule. Every expense of $10,000 or greater was classified.
To avoid clutter from overhead each contest only lists the vendors representing the top 80% of race expenditures.