 Yes, Stats and Math DO Matter
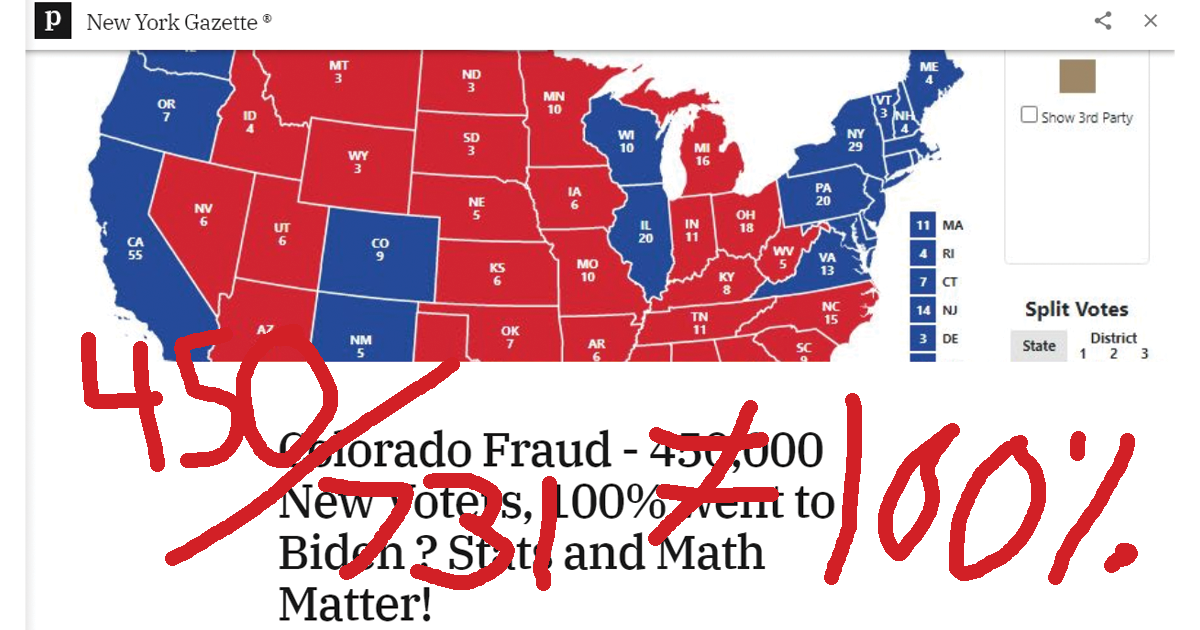
I awoke this President’s Day to half-a-dozen different people sending me this New York Gazette (whatever that is) post. It’s an analysis claiming statistical evidence of election fraud in Colorado. However, the analysis the anonymous author conducts is so laughably bad that it could have been executed by Colorado Public Radio.
The core argument is one I spend a lot of time correcting — the confusion between rates and levels. You can read even more about the distinction in the post where I take CPR to task for making the same error this “New York Gazette” piece makes.
Essentially, the author is claiming it’s impossible that 3.2 mln votes were cast in the 2020 Colorado General because the population is only 5.8 mln! …you know, 2.6 mln people greater than the number voting.
To make matters worse, they go on to claim President Biden received 100% of the “new” voters, but they forget to add in the “new” votes that President Trump received. In essence, making their conclusion – “of all the new voters who voted Democrat, they all voted Democrat!”
The NY Gazette falls into this trap because, again, they’ve focused on rates of change and not the underlying population/voter registration level.
Update
After Complete Colorado picked up this story I received an interesting pingback from a Colorado source making the same argument as the New York Gazette Post.
While their argument was very similar they made an additional point that I found quite compelling. They say that:
Notice how the population voter participation (green) remained at a steady 48% of the population through three presidential elections. Then in 2020 is shoots up to 54.56% – a 12.6% increase over the population participation rate in 2016
Mile High Evening News
Their point is that as a percentage of the population, not registered voters, about 50% voted in the Presidential Elections in 2008, 2012, and 2016. Then in 2020, the percentage of the population voting jumped up by 5 points to 55%. That seems like a pretty interesting phenomenon.
However, this is where having a little institutional knowledge helps.
Between the 2016 and 2020 elections, Colorado implemented two forms of automatic voter registration. And, since every active registered voter in the State is mailed a ballot, we’d expect to see a break from the prior trend in participation as a result of those changes.
Colorado initially introduced what I’ll call “automatic registration lite.” This meant that when people went to the DMV to receive/update their license, the box prompting them to register to vote was pre-filled in. They had to consciously choose not to vote. Then this (2020) year we implemented true automatic voter registration. Now anytime someone interacts with the DMV they aren’t even given a choice, they’re just registered as an Unaffiliated voter and mailed a ballot.
As I’ve pointed out before, left-leaning voters are much more likely to be unregistered so these changes would lead to a surge in left-leaning voters onto the rolls and is very likely responsible for the spike in participation that Mile High Evening News points out occurred between the 2016 and 2020 Presidential Elections.
This makes one of the main premises of their analysis flawed:
Colorado already has statewide mail-in voting, so we wouldn’t see a massive uptick in voter participation in 2020 due to coronavirus seen in other states, and should have seen voter participation increases in line with population increases. Yet somehow in 2016 and 2020 active voters increased by over 20% and over 14% while the population only went up 6.74% and 4.76%.
Mile High Evening News
While we may not have expected a cornavirus-driven increase in participation (and I’d debate this as well) we could expect one from such sweeping operational changes to the way our elections are conducted.
And now the kicker.
The quote above shows their other central premise which is that:
…and should have seen voter participation increases in line with population increases.
Mile High Evening News
But look at this:
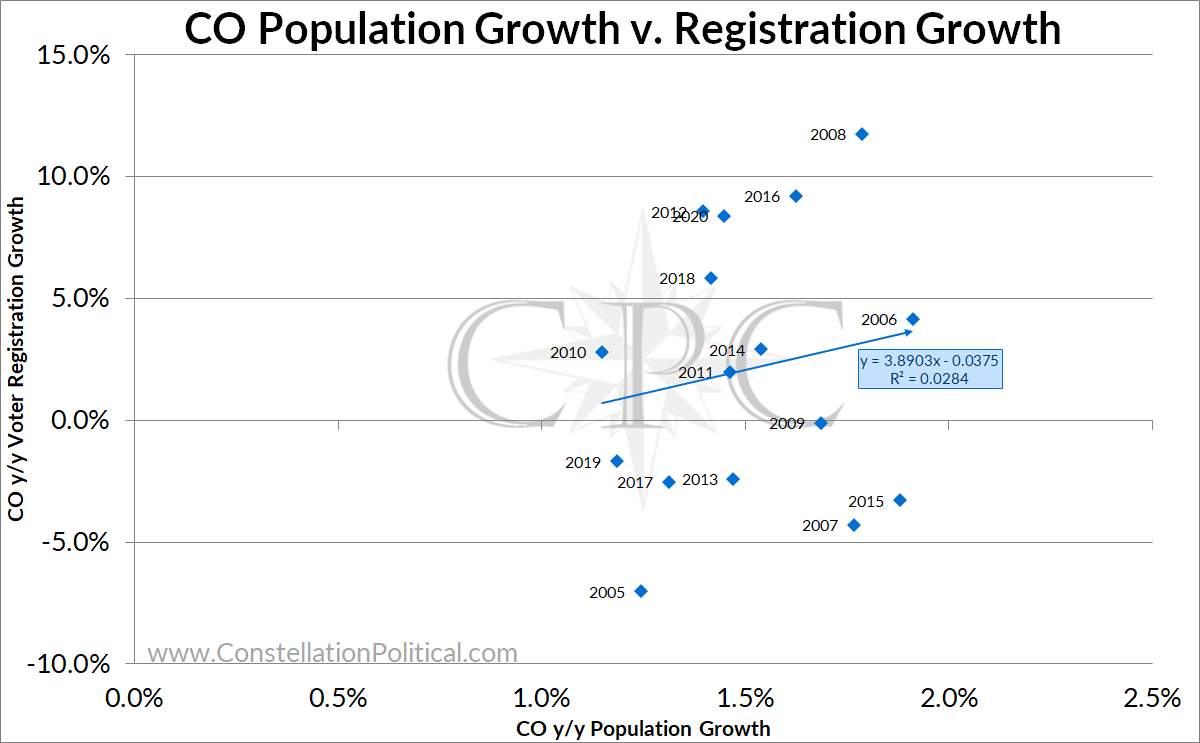
It turns out there is no correlation between population growth and voter registration to begin with. So assuming that there would be makes any analysis relying on population flawed. In fact, Mile High Evening news tacitly acknowledges this when they point out that participation remained constant while population continued to grow from 2008-2016.
Indeed, Graph 3 shows that 2008 was the year with the greatest year-over-year voter registration growth with a jump of 11.8% and population was only up 1.8% y/y that year. Whereas in 2015, population grew at the second-fastest y/y rate of the past two decades and voter registration declined.
So let’s put the population-based outcome analysis to bed.
For those who want to double-check, I used the census population figures available here, here and here. State results are available here. Registration figures are available here. And remember, only con artists use active, not total, voter registration. Original Mile High Evening News Article as it appeared on 2/22/21 is available here.
Voter Registration
The anonymous analysis suffers from a basic misunderstanding: that voter registration does, indeed, grow over time. And unfortunately in Colorado, all of that growth has been among Democrat and Unaffiliated voters.
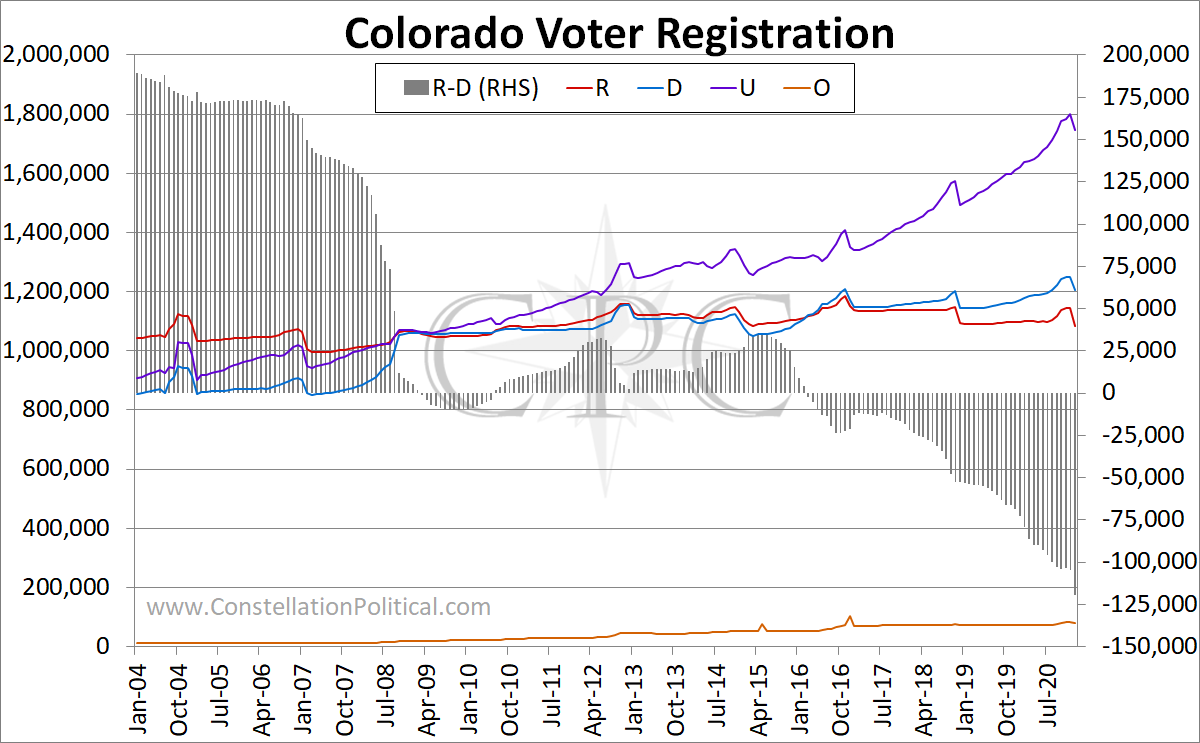
The grey bars in Graph 1 show the Republican registration advantage over Democrats. In 2004, Colorado had 190,000 more registered Republicans than Democrats. Today, there are 119,000 more registered Democrats than Republicans. As you can see in Graph 1, Republicans lost their advantage in March of 2016 and it’s only gotten worse.
Worse than the loss of our registration advantage is the fact that our voter registration level has declined. The most Republicans ever registered in Colorado was in November 2016 when we had 1,186,441 registered Republicans. Since that time we have lost 101,000 Republicans, compared to Democrats who have only lost 5,000 voters during the same period. Meanwhile, Unaffiliated voters have added 340,000 voters since that time.
Think about this: more than just votes, we’ve lost almost 10% of the core of our party during the last four years.
And with that background in mind, let’s go through the NY Gazette post point-by-point and cover the errors.
Detailed Ignorance
Quote 1

Our anonymous author really starts out strong — demonstrating that this was the first election they’d ever witnessed. The claim that there should have been “no vast difference” in voting between Midterm and Presidential elections is so laughable precisely because everyone intuitively knows this isn’t true. Of course, people are going to be more engaged in a Presidential year! Of course, turnout is going to be higher in a Presidential year!
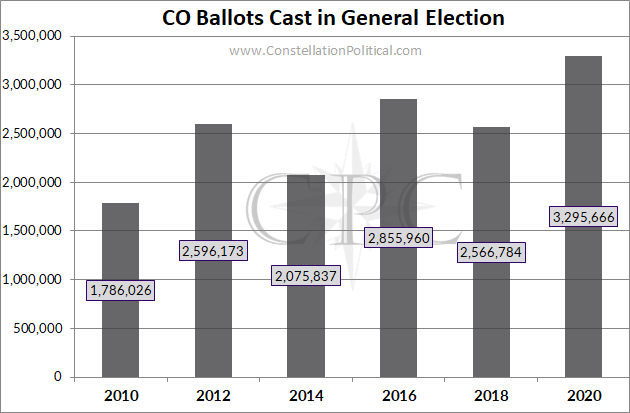
Graph 2 shows that there’s a very consistent increase in the number of ballots cast in Presidential election years versus Midterms.
Quote 2

The increase in ballots cast between 2020 and 2018 was actually 728,882, but I get that they’re rounding. What is missing, however…
Between 2010 and 2020, the average increase in ballots cast between a Presidential and the preceding Midterm has been 770,000 — greater than the 729,000 increase Colorado saw between 2020 and 2018.
Quote 3
The interesting thing about points 3 and 4 is the cognitive dissonance. In point 3 the author expresses disbelief that the number of ballots cast could be increasing, and yet in point 4 they point out that President Trump also received more votes.
This underpins one of their key errors. When they assert that “100% of the new votes went to Biden” it’s because they completely forgot to add in the new votes for President Trump as part of the total.
Quote 4

They’re obviously attempting to make the point that Dominion was behind this somehow. But if that were actually the point why not use the date that Colorado actually adopted Dominion voting machines?
One can even read the official press release from the Secretary of State stating that 2016 was the first year that Dominion was used across Colorado — the year President Trump won.
Quote 5

This one makes me crazy. This is just not true. I have written about this confusion before and you can read more about that here. Voter turnout in Colorado in 2020 was 78.6%, not 85%. Anyone using the higher number is trying to sell you something. And that person is usually Jenna Griswold.
Colorado does have very high turnout compared to the nation, but that’s always been true — even prior to all mail voting.
Quote 6
Credit where credit is due, they were able to accurately copy the numbers in Quote 6 over from the Colorado Secretary of State.
Their Conclusion
Their conclusion is where things once again turn to the hilarious end of the spectrum of bad analysis. You’ll have to bear with me here because I had a hard time following their point to begin with.
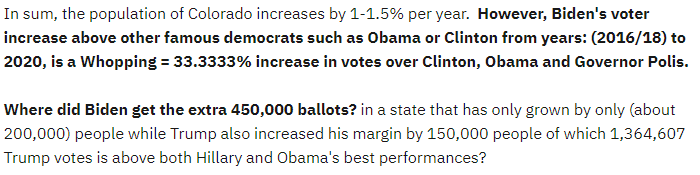
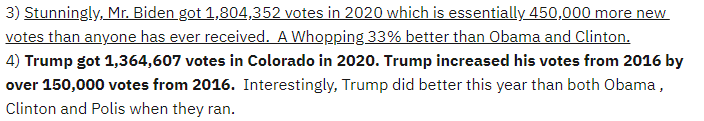
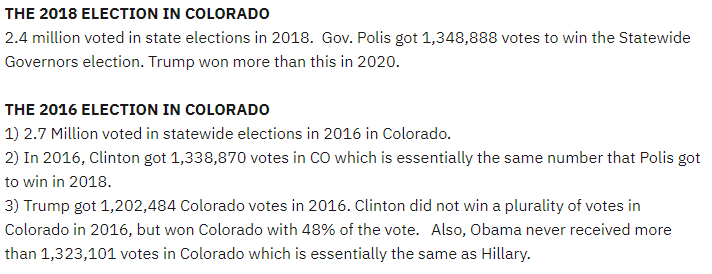
Their conclusion appears to be that it’s impossible for President Biden in 2020 to have received 450,000 more votes than Gov. Polis in 2018 because the population only grew by 200,000 during that time.
Frankly, the error here should be obvious. They are assuming that every person in Colorado votes in every election!
They say it’s impossible for President Biden to have received 1.8 mln votes in an election where 3.2 mln votes were cast because Colorado’s population hasn’t grown enough for that many people to have voted. There’s just one problem with that… they themselves point out that the population of Colorado is 5.8 mln. Well above the number of ballots cast. In fact, Colorado has had enough registered voters that the 2020 result could have been possible as far back as 2010.
This is the same mistake they made way back in his first point. They think turnout is perfectly consistent across elections.
The rest gets even more non-sensical.
Quote 8
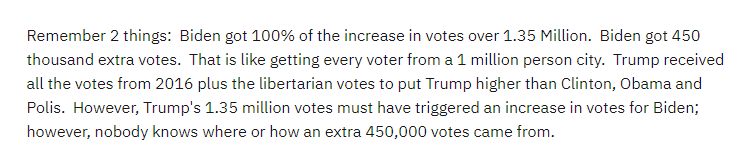
Here they’re saying “of the 450,000 new votes for a Democrat, they all went to President Biden.”
No shit! If you were voting for a Democrat in the Presidential, you only had one choice!
To be charitable, I think they just plain forgot to factor in the total increase in ballots cast between 2020 and 2018.
There were 732,000 more ballots cast in the 2020 Presidential than in the 2018 Gubernatorial.
+
President Biden received 455,000 more votes than Gov. Polis.
+
455,000 is 62% of 732,000.
=
President Biden received 62% of the “new” votes, not 100% like the author keeps claiming.
Those who’ve followed Colorado politics for a while will find that 62% number striking because it’s also roughly the percentage of Unaffiliated voters that break Democrat statewide.
Also, recall Republicans have lost 100,000 voters in the past four years. All things considered, I think President Biden only getting 62% of the “new” votes is pretty good for us Republicans.
Our anonymous author states that no one knows where these 450k votes could have come from. Of course, readers of this blog already know the answer to that as well.
Now that we’ve dispensed with this sorry attempt at psephology, let’s do the analysis I think the author meant to do. Of the new votes in 2020 how many did President Biden actually receive? And, more importantly, how does that stack up historically?
My Conclusion
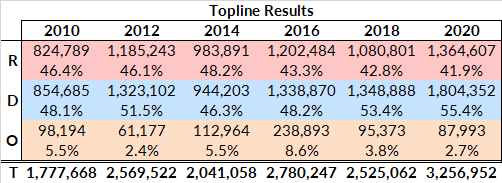
Table 1 shows the number of raw votes and the percentage of the vote that the Democrat, Republican, and Other candidates received in the top-line race in Colorado for each cycle.
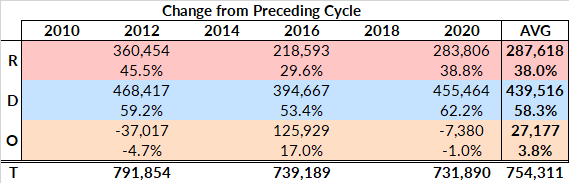
Table 2 shows the difference in votes received between the Presidential and the preceding Midterm Election. In 2020 President Biden received 455,464 more votes than Gov. Polis did in 2018. There were 731,890 more votes cast in the 2020 Presidential than there were in the 2018 Gubernatorial. 455,464 is 62.2% of 731,890. 283,806 is 38.8% of 731,890. So, of the “new” votes in 2020, President Biden received 62.2% of them, not 100% as the author claims.
Additionally, over the past three Presidential cycles, the Democrat has received, on average, 58.3% of those new voters. President Biden’s performance was just slightly better than this.
I write about this very phenomenon after every election. Because Democrats are less civically engaged, Democrats and left-leaning voters see bigger turnout improvements in Presidential elections. The inverse is why Midterm elections tend to favor Republicans. Given this dynamic, we would expect Democrats to perform better among voters who only turn out for the Presidential Election.
Stop now if You Know What’s Good for You
For those who really want to get into the weeds, I’d point out that the above method of comparing election outcomes isn’t great. Many factors make it difficult to compare election results across districts and time. Even in the corrected analysis I did above there’s a glaring wild card — the “Other” vote. Look at the huge aberration in third-party votes in the 2016 Presidential shown in Table 1.
To compare candidate performance across time, the best method is to compare performance among Unaffiliated voters. Devotees, will recall I refer to this as TLA. It works like this: if we assume every Republican voted for the Republican and every Democrat voted for the Democrat, what percentage of the remaining vote did the Republican receive?
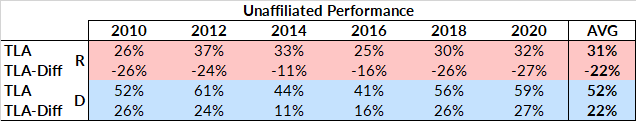
Table 3 shows that between 2010 and 2020 Republican top-line candidates have received, on average, 31% of the Unaffiliated and Third Party vote.
However, to account for third party candidates we want to subtract the Republican performance among Unaffiliated voters from the Democrat performance. This gives a measure of how much better, or worse, the Republican candidate did than the Democrat. I call this the TLA-Diff.
Table 3 shows that over the past decade, Republicans have, on average, performed 22 points worse among Unaffiliated voters than Democrats. Indeed, President Trump’s performance in 2020 is not far out of line with that. President Trump performed 27 points worse among Unaffiliated voters than President Biden did. Compare this to -26 for Rep. Buck in his 2020 Senate race and -24 for Sen. Romney during his 2012 Presidential.
All this is just another way of saying, the 2020 outcome was about as expected.
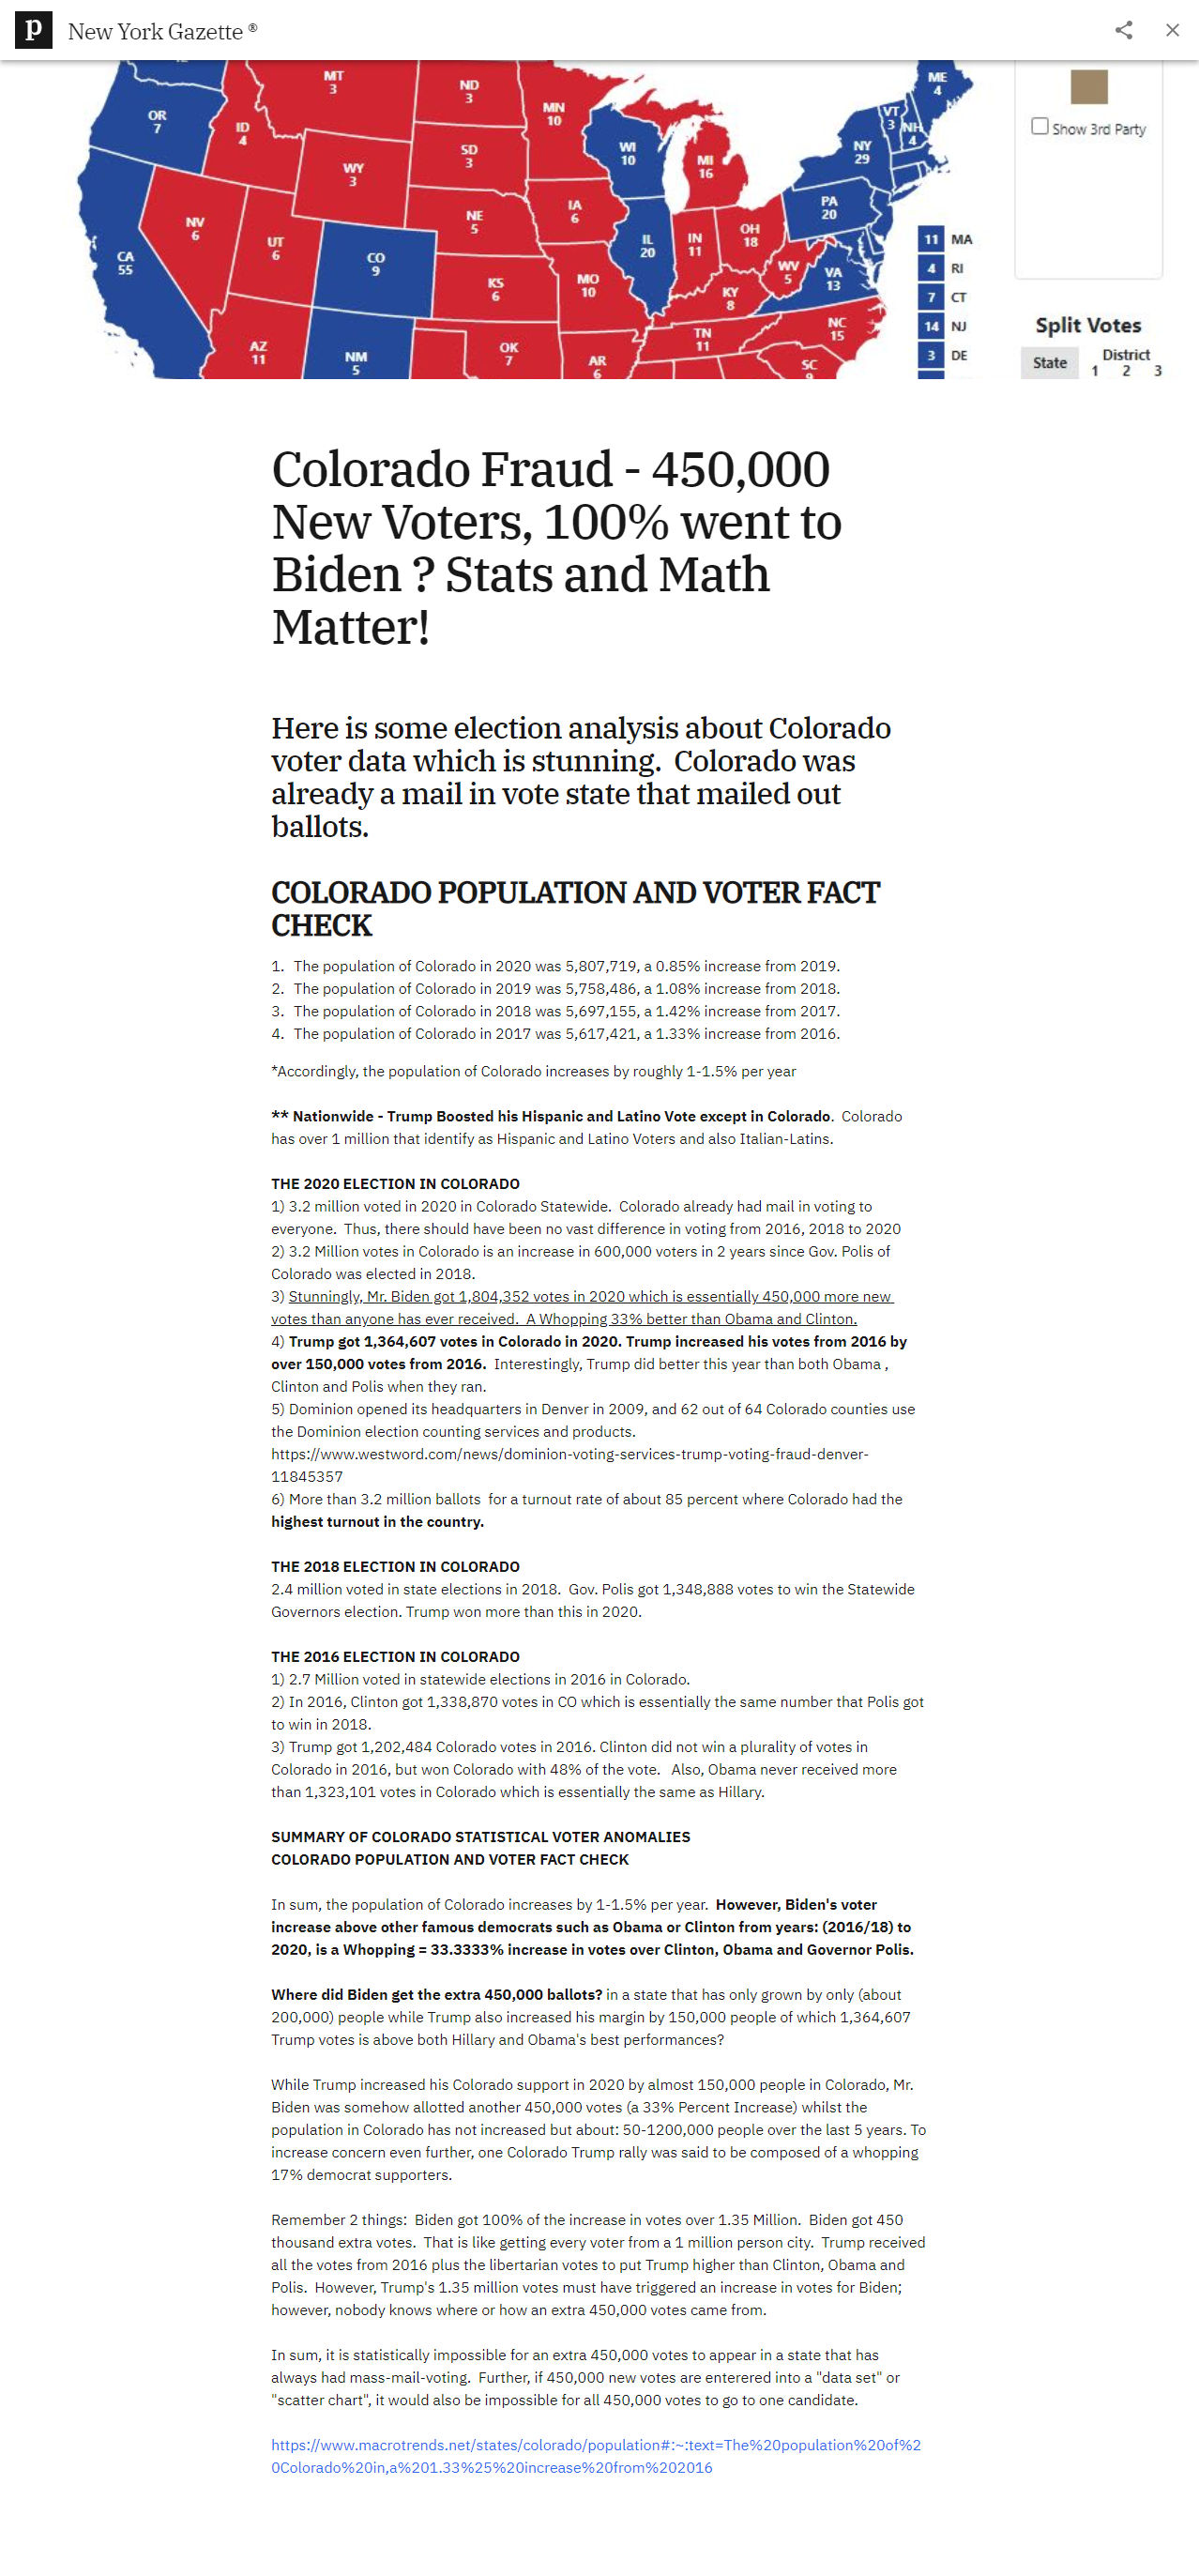
Original Post
Below is the original New York Gazette post as it appeared on 2020-02-15.
[…] Colorado (a Drudge Report lookalike for Colorado news that is well worth following), they link to a contrary analysis of the New York Gazette article challenging the Colorado presidential election results – […]